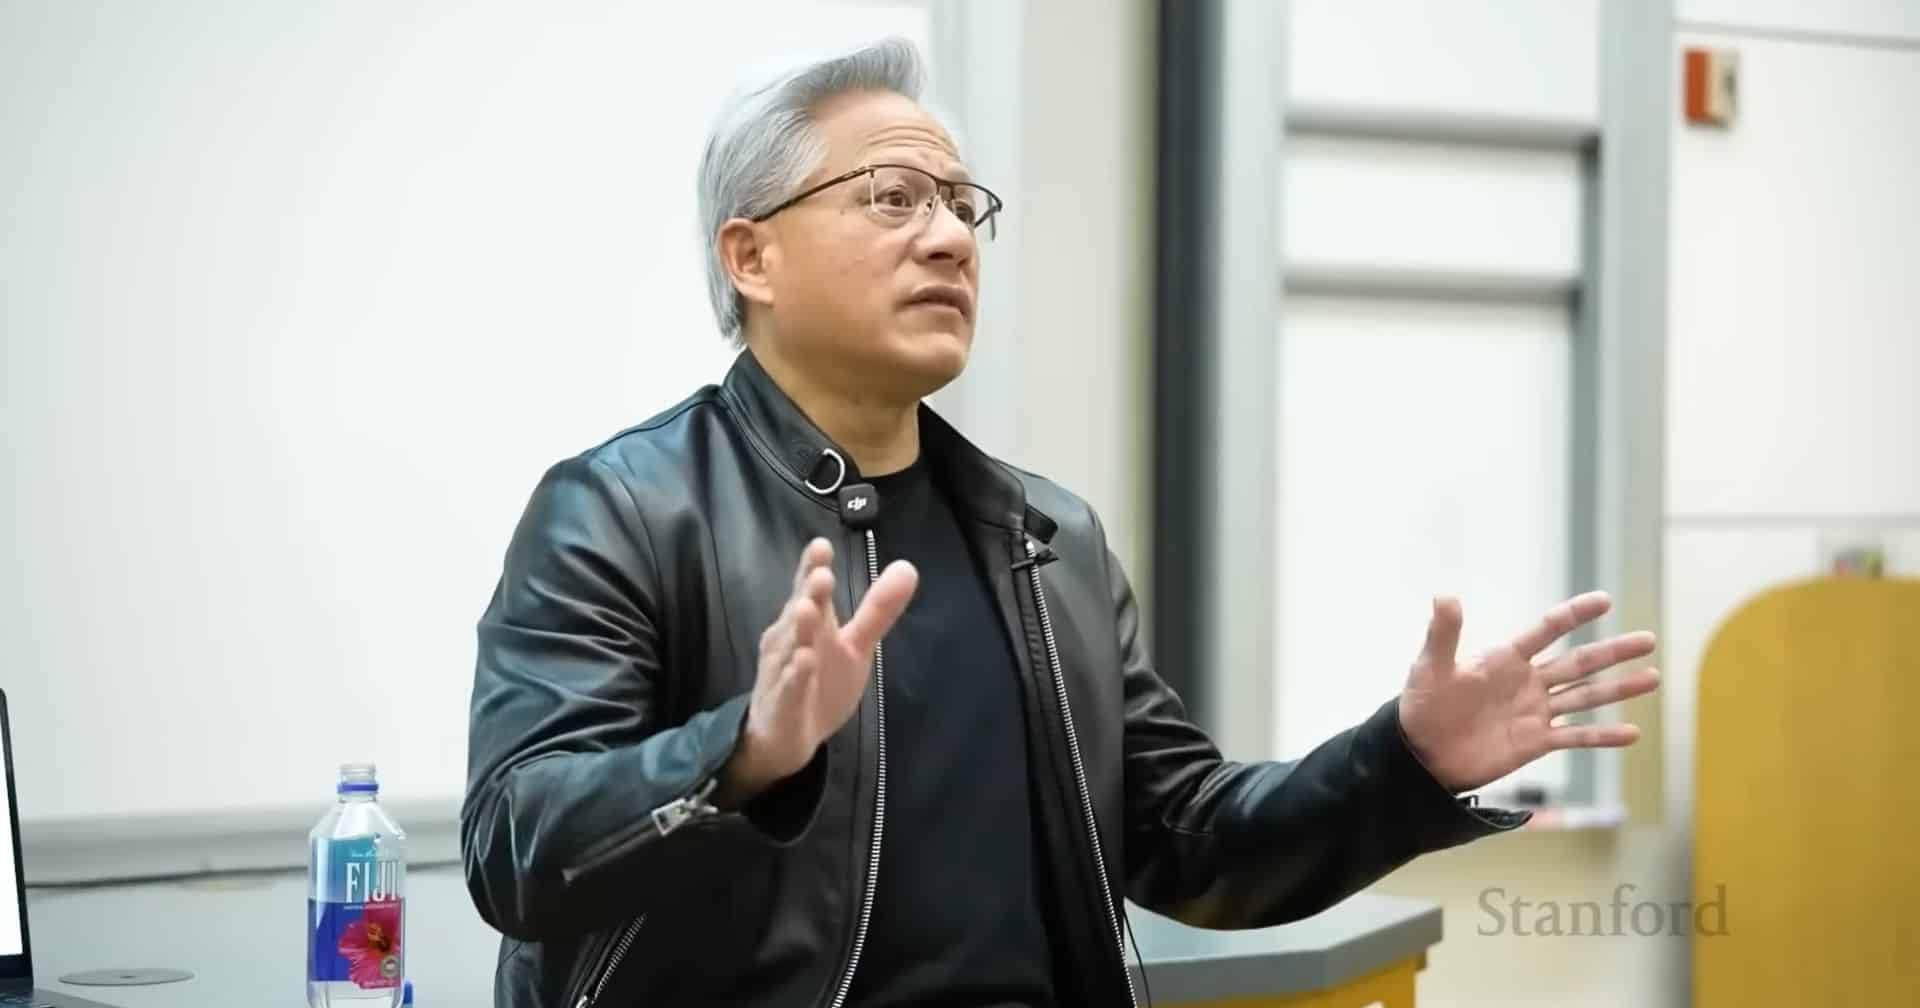
Nvidia CEO Jensen Huang estimates $100B cost for 1 GW AI factory
The price tag for building next-generation AI data centers is climbing fast, and Nvidia stands to capture roughly half of every dollar spent
NVIDIA Corporation (NVDA) price
Full chart and statsLoading chart…
- Last close
- $216
- Close-to-close change
- +2.4%
- Market cap
- Unavailable: the share count source keeps no filing date
- P/E (trailing)
- Unavailable: trailing earnings keep no period or filing date
- Annual revenue
- Unavailable: no annual filing figure
- Annual revenue growth
- Unavailable: no annual filing figure
- Annual net income
- Unavailable: no annual filing figure
- Annual operating margin
- Unavailable
- Forward P/E
- Unavailable: no dated forecast source
Gloria daily close for session Oct 26, 2026. Market cap and trailing P/E use this close with the SEC share total and trailing diluted earnings, each dated next to its figure. Annual revenue, revenue growth, net income and margin show their own fiscal period and link the 10-K. Current context may postdate this article.
Token vs underlying stock
Current comparison for NVDA. Historical observations may postdate this article.
NVDAx token unit vs NVDA share · USD
+4.6% over displayed period
● NVDAx token┄ NVDA stock: $216.00
Source: CoinGecko + Gloria · Retrieved Oct 27, 23:09 UTC · Delayed
Methodology and data
Split-adjusted regular-session stock closes from the existing Gloria shared history, paired only with an observed token price within 45 minutes of 16:00 New York time. Up to 60 matched sessions. No interpolation or missing-date fill. Weekends and known early closes are omitted. Token units are not adjusted for issuer multipliers or dividend treatment. This compares quoted prices, not fair value, executable premiums or arbitrage returns. Solid line: token. Dashed line: stock. Exact quote times and values appear below. Historical observations. Retrieval refers to the token source. Token quote times use UTC. The fixed cohort shows its oldest member fetch.
| Date (UTC) | Token (USD) | Stock close (USD) | Token quote (UTC) |
|---|---|---|---|
| 2026-08-03 | 206.65 | 206.64 | 2026-08-03 20:00 |
| 2026-08-04 | 212.33 | 211.94 | 2026-08-04 20:00 |
| 2026-08-05 | 219.87 | 219.22 | 2026-08-05 20:00 |
| 2026-08-06 | 219.15 | 218.99 | 2026-08-06 20:00 |
| 2026-08-07 | 223.93 | 223.96 | 2026-08-07 20:00 |
| 2026-08-10 | 217.66 | 217.55 | 2026-08-10 20:00 |
| 2026-08-11 | 217.53 | 217.50 | 2026-08-11 20:00 |
| 2026-08-12 | 224.12 | 224.09 | 2026-08-12 20:00 |
| 2026-08-13 | 225.42 | 225.30 | 2026-08-13 20:00 |
| 2026-08-14 | 225.34 | 225.16 | 2026-08-14 20:00 |
| 2026-08-17 | 225.13 | 225.01 | 2026-08-17 20:00 |
| 2026-08-18 | 219.70 | 219.74 | 2026-08-18 20:00 |
| 2026-08-19 | 217.76 | 217.56 | 2026-08-19 20:00 |
| 2026-08-20 | 216.79 | 216.85 | 2026-08-20 20:00 |
| 2026-08-21 | 214.85 | 214.72 | 2026-08-21 20:00 |
| 2026-08-24 | 208.75 | 208.48 | 2026-08-24 20:00 |
| 2026-08-25 | 213.16 | 213.05 | 2026-08-25 20:00 |
| 2026-08-26 | 210.06 | 209.66 | 2026-08-26 20:00 |
| 2026-08-27 | 227.96 | 227.98 | 2026-08-27 20:00 |
| 2026-08-28 | 217.74 | 217.55 | 2026-08-28 20:00 |
| 2026-08-31 | 220.91 | 220.78 | 2026-08-31 20:00 |
| 2026-09-01 | 217.58 | 217.44 | 2026-09-01 20:00 |
| 2026-09-02 | 224.46 | 224.41 | 2026-09-02 20:00 |
| 2026-09-03 | 228.90 | 228.45 | 2026-09-03 20:00 |
| 2026-09-04 | 230.35 | 230.36 | 2026-09-04 20:00 |
| 2026-09-08 | 225.69 | 225.73 | 2026-09-08 20:00 |
| 2026-09-09 | 223.89 | 223.67 | 2026-09-09 20:00 |
| 2026-09-10 | 218.70 | 218.36 | 2026-09-10 20:00 |
| 2026-09-11 | 218.92 | 218.29 | 2026-09-11 20:00 |
| 2026-09-14 | 211.47 | 210.96 | 2026-09-14 20:00 |
| 2026-09-15 | 212.34 | 212.17 | 2026-09-15 20:00 |
| 2026-09-16 | 214.25 | 213.90 | 2026-09-16 20:00 |
| 2026-09-17 | 219.68 | 219.34 | 2026-09-17 20:00 |
| 2026-09-18 | 222.24 | 222.27 | 2026-09-18 20:00 |
| 2026-09-21 | 227.69 | 227.38 | 2026-09-21 20:00 |
| 2026-09-22 | 229.20 | 228.87 | 2026-09-22 20:00 |
| 2026-09-23 | 225.44 | 225.51 | 2026-09-23 20:00 |
| 2026-09-24 | 224.87 | 224.58 | 2026-09-24 20:00 |
| 2026-09-25 | 225.29 | 225.07 | 2026-09-25 20:00 |
| 2026-09-28 | 228.97 | 228.86 | 2026-09-28 20:00 |
| 2026-09-29 | 227.95 | 227.21 | 2026-09-29 20:00 |
| 2026-09-30 | 229.85 | 228.38 | 2026-09-30 20:00 |
| 2026-10-01 | 231.18 | 230.86 | 2026-10-01 20:00 |
| 2026-10-02 | 234.38 | 233.95 | 2026-10-02 20:00 |
| 2026-10-05 | 239.30 | 238.90 | 2026-10-05 20:00 |
| 2026-10-06 | 239.71 | 239.24 | 2026-10-06 20:00 |
| 2026-10-07 | 237.80 | 237.47 | 2026-10-07 20:00 |
| 2026-10-08 | 230.81 | 230.48 | 2026-10-08 20:00 |
| 2026-10-09 | 229.70 | 229.28 | 2026-10-09 20:00 |
| 2026-10-12 | 226.87 | 226.32 | 2026-10-12 20:00 |
| 2026-10-13 | 228.73 | 228.52 | 2026-10-13 20:00 |
| 2026-10-14 | 221.56 | 221.30 | 2026-10-14 20:00 |
| 2026-10-15 | 217.48 | 217.23 | 2026-10-15 20:00 |
| 2026-10-16 | 214.56 | 214.13 | 2026-10-16 20:00 |
| 2026-10-19 | 217.41 | 217.09 | 2026-10-19 20:00 |
| 2026-10-20 | 216.69 | 216.47 | 2026-10-20 20:00 |
| 2026-10-21 | 222.20 | 221.97 | 2026-10-21 20:00 |
| 2026-10-22 | 212.42 | 212.21 | 2026-10-22 20:00 |
| 2026-10-23 | 211.27 | 210.96 | 2026-10-23 20:00 |
| 2026-10-26 | 216.15 | 216.00 | 2026-10-26 20:00 |
Stock history: Gloria · Retrieved Oct 27, 00:32 UTC. Token history: CoinGecko NVDAx.
Quoted token and share units can have different rights, multipliers and dividend treatment. This is not an executable premium or arbitrage signal.
Jensen Huang just put a number on the future of AI infrastructure, and it’s the kind of figure that makes even Big Tech CFOs pause. The Nvidia CEO estimates that a single 1 gigawatt AI factory, the massive data center complexes needed to train and run frontier AI models, could cost up to $100 billion.
That number is up from current estimates of around $55 billion per gigawatt. And here’s the part that should matter to anyone watching capital flows in tech: roughly half of that spend goes directly to Nvidia’s chips and systems.
The math behind the megawatt madness
Earlier estimates from mid-2025 pegged the cost of a 1 GW AI factory at $50 to $60 billion, with about $35 billion earmarked for Nvidia hardware. Huang’s updated projection suggests costs are trending upward as the complexity of AI workloads increases and the demand for more sophisticated silicon accelerates.
Reports from June 2026 noted that a fully operational 1 GW factory could generate $300 to $400 billion in annual intelligence value. That implies a payback period of just 2 to 3 years at full utilization.
Nvidia’s OpenAI partnership sets the scale
Nvidia and OpenAI announced a partnership on September 22, 2025, focused on deploying 10 GW worth of Nvidia systems. If each gigawatt eventually hits the $100 billion mark, we’re looking at a trillion-dollar infrastructure buildout between just two companies.
AI, tech, and the markets they move—in one daily briefing.
Daily. Free. Join 34,000+ readers across crypto, finance, and policy.
Nvidia committed to investing up to $100 billion over time as each gigawatt becomes operational. The first GW is targeted for deployment in the second half of 2026, running on Nvidia’s Vera Rubin platform, the successor architecture to Blackwell.
What this means for investors
Capturing roughly half the capex of every AI factory built means Nvidia’s revenue ceiling keeps rising as long as the buildout continues. The company’s market share in AI accelerators remains dominant, and architectures like Vera Rubin are designed to maintain that lead through the next generation of scaling.
The sheer magnitude of capital required creates concentration risk across the tech sector. A $100 billion factory doesn’t get funded by mid-cap companies. This is a game for Microsoft, Google, Amazon, and sovereign wealth funds.
The 2 to 3 year payback claim assumes full utilization of these facilities, which in turn assumes that demand for AI inference and training continues growing at its current trajectory. If enterprise adoption of AI plateaus, or if a major model architecture shift reduces compute requirements, the ROI math changes dramatically.
Disclosure: This article was edited by Editorial Team. For more information on how we create and review content, see our Editorial Policy.

