+65.5% (FY ended 2026-01-25 vs FY ended 2025-01-26) 10-K
Annual net income
120,067,000,000 USD (FY ended 2026-01-25, attributable to the company) 10-K
Annual operating margin
60.4% (FY ended 2026-01-25)
Forward P/E
Unavailable: no dated forecast source
Gloria daily close for session Oct 28, 2026. Market cap and trailing P/E use this close with the SEC share total and trailing diluted earnings, each dated next to its figure. Annual revenue, revenue growth, net income and margin show their own fiscal period and link the 10-K. Current context may postdate this article.
4,335,000,000FY ended 2025-12-27, attributable to the company · 10-K
10.7%FY ended 2025-12-27
Missing figures stay unavailable. Forward P/E requires a dated source. Annual revenue, revenue growth, net income and margin come from each company's own 10-K, in US dollars, and each row shows that fiscal year. Revenue growth compares the fiscal year with the prior year stated in the same 10-K. Net income is the full year amount attributable to the company, or available to common stockholders where the filing states only that, or consolidated net income. Each row names its basis. Trailing P/E reads "Not meaningful" when the dated trailing diluted EPS is a loss or zero. An operating margin appears only when the filing states both the operating income and the revenue for the same year.
Sources: SEC filings, Gloria daily closes and CoinGecko. Oldest record refresh: Oct 28, 2026, 5:46 PM EDT. Refresh is not a price or filing date. Each row shows its price date and its annual fiscal period. Peers use industry code and company size, or editorial selection. Market cap multiplies that row price by the company share total the latest SEC filing states for every share class together. Trailing P/E divides it by trailing diluted earnings from SEC filings. Rolled earnings per share are approximate because share counts can change between periods. Both appear only when the SEC data carries its date, so they are estimates at one price date, not synchronized filing valuations. Not investment advice.
Token vs underlying stock
Current comparison for NVDA. Historical observations may postdate this article.
Split-adjusted regular-session stock closes from the existing Gloria shared history, paired only with an observed token price within 45 minutes of 16:00 New York time. Up to 60 matched sessions. No interpolation or missing-date fill. Weekends and known early closes are omitted. Token units are not adjusted for issuer multipliers or dividend treatment. This compares quoted prices, not fair value, executable premiums or arbitrage returns. Solid line: token. Dashed line: stock. Exact quote times and values appear below. Historical observations. Retrieval refers to the token source. Token quote times use UTC. The fixed cohort shows its oldest member fetch.
Nvidia token vs Nvidia stock: exact source values
Date (UTC)
Token (USD)
Stock close (USD)
Token quote (UTC)
2026-08-05
219.87
219.22
2026-08-05 20:00
2026-08-06
219.15
218.99
2026-08-06 20:00
2026-08-07
223.93
223.96
2026-08-07 20:00
2026-08-10
217.66
217.55
2026-08-10 20:00
2026-08-11
217.53
217.50
2026-08-11 20:00
2026-08-12
224.12
224.09
2026-08-12 20:00
2026-08-13
225.42
225.30
2026-08-13 20:00
2026-08-14
225.34
225.16
2026-08-14 20:00
2026-08-17
225.13
225.01
2026-08-17 20:00
2026-08-18
219.70
219.74
2026-08-18 20:00
2026-08-19
217.76
217.56
2026-08-19 20:00
2026-08-20
216.79
216.85
2026-08-20 20:00
2026-08-21
214.85
214.72
2026-08-21 20:00
2026-08-24
208.75
208.48
2026-08-24 20:00
2026-08-25
213.16
213.05
2026-08-25 20:00
2026-08-26
210.06
209.66
2026-08-26 20:00
2026-08-27
227.96
227.98
2026-08-27 20:00
2026-08-28
217.74
217.55
2026-08-28 20:00
2026-08-31
220.91
220.78
2026-08-31 20:00
2026-09-01
217.58
217.44
2026-09-01 20:00
2026-09-02
224.46
224.41
2026-09-02 20:00
2026-09-03
228.90
228.45
2026-09-03 20:00
2026-09-04
230.35
230.36
2026-09-04 20:00
2026-09-08
225.69
225.73
2026-09-08 20:00
2026-09-09
223.89
223.67
2026-09-09 20:00
2026-09-10
218.70
218.36
2026-09-10 20:00
2026-09-11
218.92
218.29
2026-09-11 20:00
2026-09-14
211.47
210.96
2026-09-14 20:00
2026-09-15
212.34
212.17
2026-09-15 20:00
2026-09-16
214.25
213.90
2026-09-16 20:00
2026-09-17
219.68
219.34
2026-09-17 20:00
2026-09-18
222.24
222.27
2026-09-18 20:00
2026-09-21
227.69
227.38
2026-09-21 20:00
2026-09-22
229.20
228.87
2026-09-22 20:00
2026-09-23
225.44
225.51
2026-09-23 20:00
2026-09-24
224.87
224.58
2026-09-24 20:00
2026-09-25
225.29
225.07
2026-09-25 20:00
2026-09-28
228.97
228.86
2026-09-28 20:00
2026-09-29
227.95
227.21
2026-09-29 20:00
2026-09-30
229.85
228.38
2026-09-30 20:00
2026-10-01
231.18
230.86
2026-10-01 20:00
2026-10-02
234.38
233.95
2026-10-02 20:00
2026-10-05
239.30
238.90
2026-10-05 20:00
2026-10-06
239.71
239.24
2026-10-06 20:00
2026-10-07
237.80
237.47
2026-10-07 20:00
2026-10-08
230.81
230.48
2026-10-08 20:00
2026-10-09
229.70
229.28
2026-10-09 20:00
2026-10-12
226.87
226.32
2026-10-12 20:00
2026-10-13
228.73
228.52
2026-10-13 20:00
2026-10-14
221.56
221.30
2026-10-14 20:00
2026-10-15
217.48
217.23
2026-10-15 20:00
2026-10-16
214.56
214.13
2026-10-16 20:00
2026-10-19
217.41
217.09
2026-10-19 20:00
2026-10-20
216.69
216.47
2026-10-20 20:00
2026-10-21
222.20
221.97
2026-10-21 20:00
2026-10-22
212.42
212.21
2026-10-22 20:00
2026-10-23
211.27
210.96
2026-10-23 20:00
2026-10-26
216.15
216.00
2026-10-26 20:00
2026-10-27
218.06
217.94
2026-10-27 20:00
2026-10-28
215.14
215.38
2026-10-28 19:49
Stock history: Gloria · Retrieved Oct 29, 00:31 UTC. Token history: CoinGecko NVDAx.
Quoted token and share units can have different rights, multipliers and dividend treatment. This is not an executable premium or arbitrage signal.
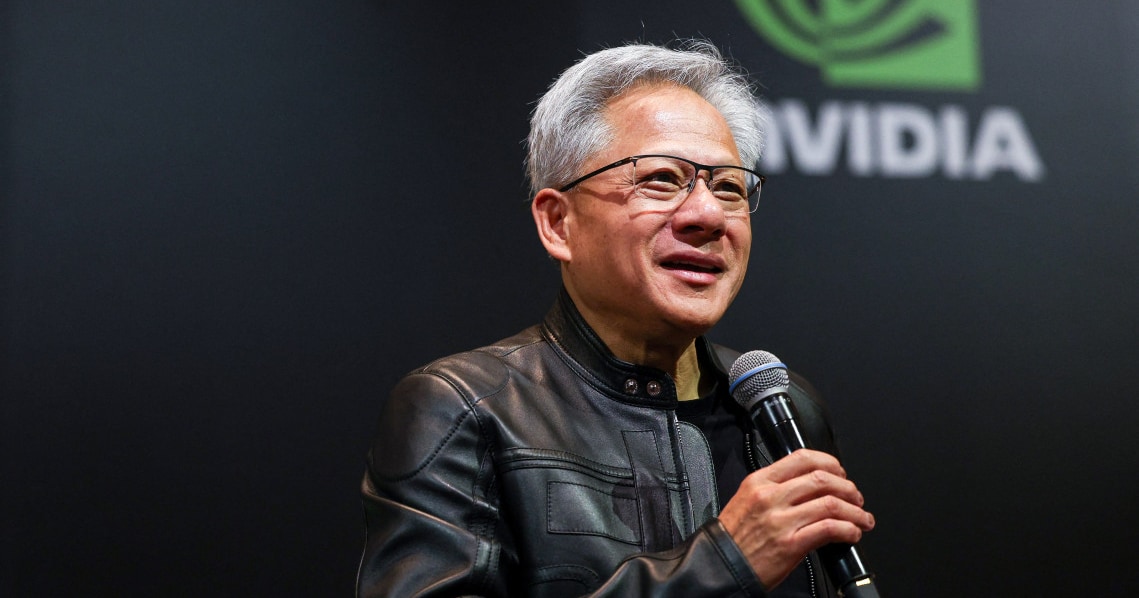
Jensen Huang wants you to think of artificial intelligence like a cake. Five layers, to be specific: energy, chips, infrastructure, models, and applications. And in a March 10 blog post, the Nvidia CEO made it clear that anyone cutting off the top layer is ruining the whole dessert.
Huang’s central argument is straightforward. Every successful AI application creates demand that cascades down through the entire stack, from the software interface a user touches all the way to the power plant humming in the background. Restrict the application layer, and you starve everything beneath it.
The five-layer cake, explained
Here’s the framework Huang laid out: Energy feeds chips. Chips feed infrastructure. Infrastructure feeds models. Models feed applications. Applications are where actual economic value gets generated, where businesses and consumers interact with AI in ways that justify the enormous capital expenditure at every layer below.
‘Every successful application pulls on every layer beneath it, all the way down to the power plant that keeps it alive.’
This isn’t a new idea from Huang. He first outlined the five-layer framework at the Davos conference in January 2026. The March blog post was his re-emergence into public discourse after months of relative silence on the topic, and it reads like a sharpened version of the same thesis.
The implicit audience here isn’t developers or investors. It’s policymakers. Huang is making the case that regulatory constraints on AI applications don’t just slow down one piece of the puzzle. They create a cascading effect that undermines investment in energy, semiconductor manufacturing, data center infrastructure, and model development.
The job creation counterargument
Huang also took direct aim at one of the most persistent narratives surrounding AI: that it destroys jobs. His position is the opposite. He argues that AI creates employment opportunities across all five layers of the stack, from energy workers to chip designers to application developers.
AI, tech, and the markets they move—in one daily briefing.
Daily. Free. Join 34,000+ readers across crypto, finance, and policy.
Huang’s analogy to historical industrial buildouts like electrification is deliberate. Building and maintaining the physical infrastructure for AI, from power generation to semiconductor fabs to data centers, does require enormous human capital. But Huang’s framework sidesteps what happens to the accountant whose work gets automated by an application sitting on top of that stack.
Open source as accelerant
One of the more interesting elements of Huang’s blog post was his endorsement of open-source AI models. He specifically cited DeepSeek-R1, the open-source reasoning model, as a catalyst for adoption at the application layer.
Open-source models lower the barrier to entry for application developers. More developers building more applications means more demand for compute. More demand for compute means more demand for Nvidia’s GPUs. Huang doesn’t need to own the model layer to win. He just needs as many people as possible building on top of it.
DeepSeek-R1’s role here is worth watching. As an open-source reasoning model, it enables developers and smaller companies to build sophisticated AI applications without licensing proprietary models from the handful of companies that can afford to train them. That expands the application layer significantly, which, per Huang’s framework, expands demand at every layer beneath it.
What this means for investors
The regulatory angle matters enormously. Investors watching for policy signals should pay attention to whether governments adopt frameworks that distinguish between AI model governance and application-layer restrictions. A regulatory regime that heavily constrains applications, think strict liability for AI-generated outputs or broad bans on specific use cases, would compress demand across the entire stack.
Conversely, a regulatory environment that focuses governance at the model layer while leaving the application layer relatively open would be exactly the outcome Huang is advocating for. That scenario maximizes the surface area for AI deployment, which maximizes compute demand, which maximizes Nvidia’s addressable market.
The competitive landscape is also shifting beneath these conversations. Open-source models like DeepSeek-R1 are creating a more fragmented and competitive application layer, which could benefit infrastructure providers like Nvidia at the expense of companies trying to monetize proprietary models.
Disclosure: This article was edited by Editorial Team. For more information on how we create and review content, see our Editorial Policy.