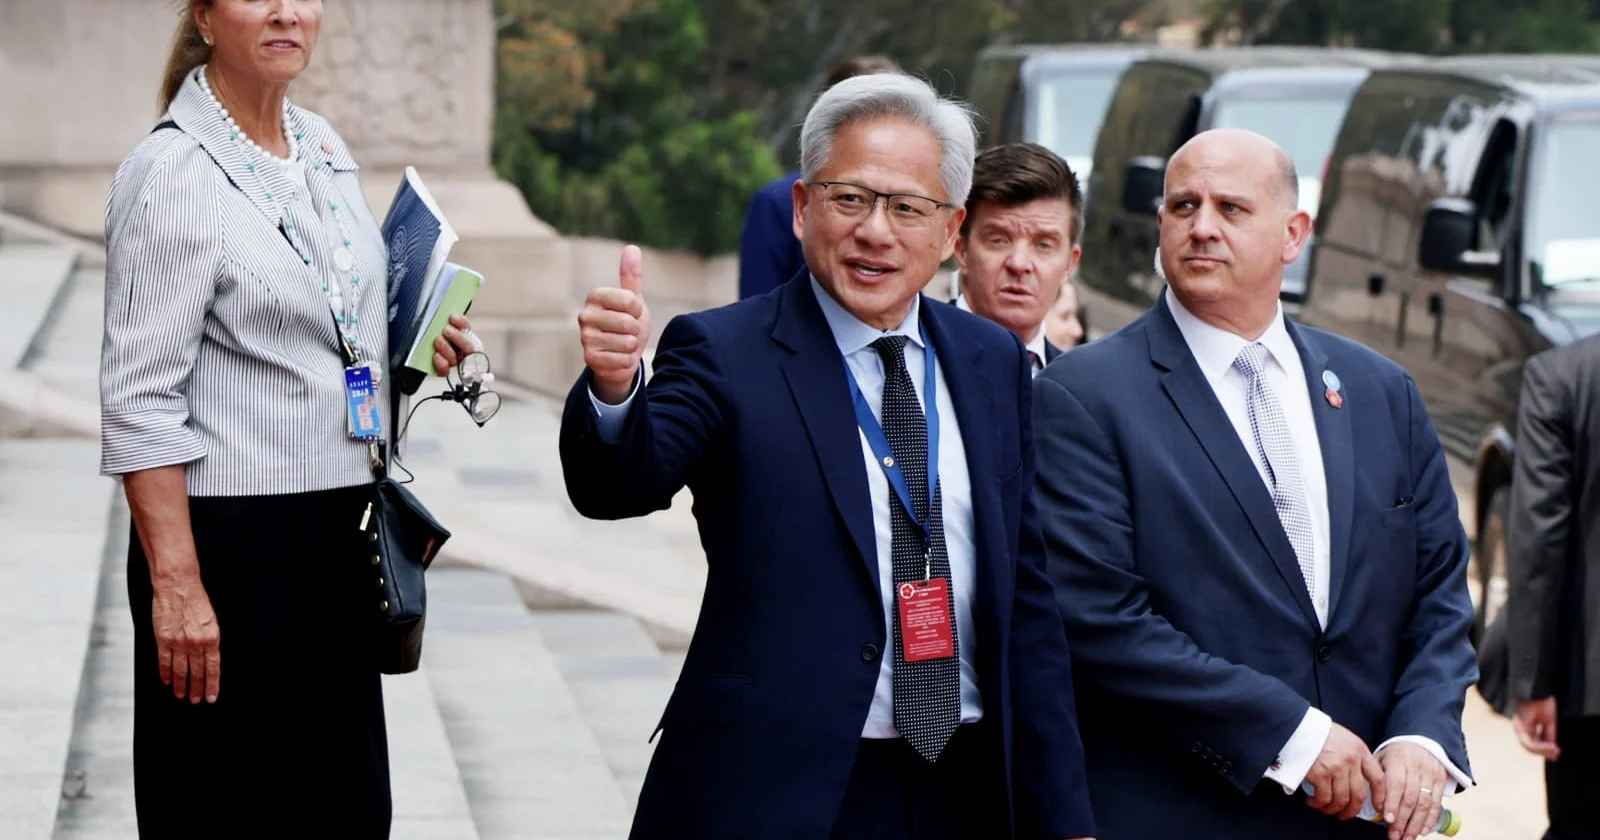
Nvidia CEO Jensen Huang declares support for President Trump at Beijing summit
The chipmaker's chief attended the Trump-Xi summit in Beijing, calling it 'one of the most important summits in human history' as Nvidia deepens its ties to the White House.
+65.5% (FY ended 2026-01-25 vs FY ended 2025-01-26) 10-K
Annual net income
120,067,000,000 USD (FY ended 2026-01-25, attributable to the company) 10-K
Annual operating margin
60.4% (FY ended 2026-01-25)
Forward P/E
Unavailable: no dated forecast source
Gloria daily close for session Oct 27, 2026. Market cap and trailing P/E use this close with the SEC share total and trailing diluted earnings, each dated next to its figure. Annual revenue, revenue growth, net income and margin show their own fiscal period and link the 10-K. Current context may postdate this article.
4,335,000,000FY ended 2025-12-27, attributable to the company · 10-K
10.7%FY ended 2025-12-27
Missing figures stay unavailable. Forward P/E requires a dated source. Annual revenue, revenue growth, net income and margin come from each company's own 10-K, in US dollars, and each row shows that fiscal year. Revenue growth compares the fiscal year with the prior year stated in the same 10-K. Net income is the full year amount attributable to the company, or available to common stockholders where the filing states only that, or consolidated net income. Each row names its basis. Trailing P/E reads "Not meaningful" when the dated trailing diluted EPS is a loss or zero. An operating margin appears only when the filing states both the operating income and the revenue for the same year.
Sources: SEC filings, Gloria daily closes and CoinGecko. Oldest record refresh: Oct 27, 2026, 9:41 PM EDT. Refresh is not a price or filing date. Each row shows its price date and its annual fiscal period. Peers use industry code and company size, or editorial selection. Market cap multiplies that row price by the company share total the latest SEC filing states for every share class together. Trailing P/E divides it by trailing diluted earnings from SEC filings. Rolled earnings per share are approximate because share counts can change between periods. Both appear only when the SEC data carries its date, so they are estimates at one price date, not synchronized filing valuations. Not investment advice.
Token vs underlying stock
Current comparison for NVDA. Historical observations may postdate this article.
Split-adjusted regular-session stock closes from the existing Gloria shared history, paired only with an observed token price within 45 minutes of 16:00 New York time. Up to 60 matched sessions. No interpolation or missing-date fill. Weekends and known early closes are omitted. Token units are not adjusted for issuer multipliers or dividend treatment. This compares quoted prices, not fair value, executable premiums or arbitrage returns. Solid line: token. Dashed line: stock. Exact quote times and values appear below. Historical observations. Retrieval refers to the token source. Token quote times use UTC. The fixed cohort shows its oldest member fetch.
Nvidia token vs Nvidia stock: exact source values
Date (UTC)
Token (USD)
Stock close (USD)
Token quote (UTC)
2026-08-04
212.33
211.94
2026-08-04 20:00
2026-08-05
219.87
219.22
2026-08-05 20:00
2026-08-06
219.15
218.99
2026-08-06 20:00
2026-08-07
223.93
223.96
2026-08-07 20:00
2026-08-10
217.66
217.55
2026-08-10 20:00
2026-08-11
217.53
217.50
2026-08-11 20:00
2026-08-12
224.12
224.09
2026-08-12 20:00
2026-08-13
225.42
225.30
2026-08-13 20:00
2026-08-14
225.34
225.16
2026-08-14 20:00
2026-08-17
225.13
225.01
2026-08-17 20:00
2026-08-18
219.70
219.74
2026-08-18 20:00
2026-08-19
217.76
217.56
2026-08-19 20:00
2026-08-20
216.79
216.85
2026-08-20 20:00
2026-08-21
214.85
214.72
2026-08-21 20:00
2026-08-24
208.75
208.48
2026-08-24 20:00
2026-08-25
213.16
213.05
2026-08-25 20:00
2026-08-26
210.06
209.66
2026-08-26 20:00
2026-08-27
227.96
227.98
2026-08-27 20:00
2026-08-28
217.74
217.55
2026-08-28 20:00
2026-08-31
220.91
220.78
2026-08-31 20:00
2026-09-01
217.58
217.44
2026-09-01 20:00
2026-09-02
224.46
224.41
2026-09-02 20:00
2026-09-03
228.90
228.45
2026-09-03 20:00
2026-09-04
230.35
230.36
2026-09-04 20:00
2026-09-08
225.69
225.73
2026-09-08 20:00
2026-09-09
223.89
223.67
2026-09-09 20:00
2026-09-10
218.70
218.36
2026-09-10 20:00
2026-09-11
218.92
218.29
2026-09-11 20:00
2026-09-14
211.47
210.96
2026-09-14 20:00
2026-09-15
212.34
212.17
2026-09-15 20:00
2026-09-16
214.25
213.90
2026-09-16 20:00
2026-09-17
219.68
219.34
2026-09-17 20:00
2026-09-18
222.24
222.27
2026-09-18 20:00
2026-09-21
227.69
227.38
2026-09-21 20:00
2026-09-22
229.20
228.87
2026-09-22 20:00
2026-09-23
225.44
225.51
2026-09-23 20:00
2026-09-24
224.87
224.58
2026-09-24 20:00
2026-09-25
225.29
225.07
2026-09-25 20:00
2026-09-28
228.97
228.86
2026-09-28 20:00
2026-09-29
227.95
227.21
2026-09-29 20:00
2026-09-30
229.85
228.38
2026-09-30 20:00
2026-10-01
231.18
230.86
2026-10-01 20:00
2026-10-02
234.38
233.95
2026-10-02 20:00
2026-10-05
239.30
238.90
2026-10-05 20:00
2026-10-06
239.71
239.24
2026-10-06 20:00
2026-10-07
237.80
237.47
2026-10-07 20:00
2026-10-08
230.81
230.48
2026-10-08 20:00
2026-10-09
229.70
229.28
2026-10-09 20:00
2026-10-12
226.87
226.32
2026-10-12 20:00
2026-10-13
228.73
228.52
2026-10-13 20:00
2026-10-14
221.56
221.30
2026-10-14 20:00
2026-10-15
217.48
217.23
2026-10-15 20:00
2026-10-16
214.56
214.13
2026-10-16 20:00
2026-10-19
217.41
217.09
2026-10-19 20:00
2026-10-20
216.69
216.47
2026-10-20 20:00
2026-10-21
222.20
221.97
2026-10-21 20:00
2026-10-22
212.42
212.21
2026-10-22 20:00
2026-10-23
211.27
210.96
2026-10-23 20:00
2026-10-26
216.15
216.00
2026-10-26 20:00
2026-10-27
218.06
217.94
2026-10-27 20:00
Stock history: Gloria · Retrieved Oct 28, 00:31 UTC. Token history: CoinGecko NVDAx.
Quoted token and share units can have different rights, multipliers and dividend treatment. This is not an executable premium or arbitrage signal.
Jensen Huang, the leather-jacket-wearing CEO who turned Nvidia into the most valuable company on the planet, flew to Beijing this week to stand alongside President Trump at a summit with Chinese President Xi Jinping. His message was unambiguous: he’s backing this administration.
Huang described the May 12-14 gathering as “one of the most important summits in human history” and called his attendance an “incredible opportunity” to represent US interests and support Trump.
From chip deals to political capital
Huang’s presence in Beijing wasn’t spontaneous networking. Nvidia confirmed the trip came from a last-minute invitation directly from President Trump, designed to promote US interests during the delicate diplomatic proceedings with China.
The invitation makes more sense when you look at the timeline. In March 2026, Huang was appointed to the President’s Council of Advisors on Science and Technology, known as PCAST. He joined a roster that includes Mark Zuckerberg and Marc Andreessen, essentially forming a tech advisory supergroup for the White House.
Advertisement
And back in December 2025, Huang successfully advocated for approval to sell Nvidia’s H200 chips to China. That’s not a small thing. The H200 is a serious piece of AI hardware, and getting the green light to ship it to Chinese buyers required navigating one of the most politically charged trade issues in tech.
The semiconductor chess match with China
Nvidia has been caught in the middle of this tug-of-war repeatedly. The company has had to design watered-down versions of its best GPUs specifically to comply with export rules, only to watch the goalposts move as Washington tightened restrictions further.
AI, tech, and the markets they move—in one daily briefing.
Daily. Free. Join 34,000+ readers across crypto, finance, and policy.
Huang’s strategy appears to be: if you can’t beat the regulators, join the president’s advisory council. His PCAST appointment and summit appearance suggest Nvidia is trying to influence policy from the inside rather than simply react to it. The successful H200 export approval from December 2025 is evidence that this approach is working.
What this means for investors
Nvidia’s strategic alignment with the Trump administration could lead to further relaxation of semiconductor export controls. If more high-end chips get approved for sale to Chinese buyers, that opens a revenue stream that has been partially dammed up for years.
The PCAST appointment also positions Huang to shape AI policy more broadly. Regulations around AI training, data usage, and compute infrastructure could all be influenced by the advisory council.
The broader semiconductor industry is watching this dynamic carefully. Competitors like AMD and Intel don’t have their CEOs on PCAST or attending diplomatic summits. That asymmetry in political access could translate to asymmetry in market access, particularly in China.
No crypto tokens were tied to Huang’s summit participation. The story here is pure semiconductors, pure geopolitics, and the increasingly blurred line between Silicon Valley boardrooms and Washington power.
Disclosure: This article was edited by Editorial Team. For more information on how we create and review content, see our Editorial Policy.
AI, tech, and the markets they move—in one daily briefing.Daily. Free. Join 34,000+ readers across crypto, finance, and policy.
Free daily briefing
Crypto Briefing Pro
The news about what you hold
Follow your stocks and crypto. Read the news about them from hundreds of publishers in Pro.