Nvidia stock falls 2% despite strong revenue forecast
Beating Wall Street expectations wasn't enough to satisfy a market that's priced Nvidia for perfection.
Nvidia just posted quarterly revenue of approximately $51.2 billion. The stock dropped anyway.
That’s the kind of paradox that defines the AI trade in 2025. A company delivers blockbuster numbers, guides even higher, and investors respond by heading for the exits. Nvidia shares slid roughly 2% following the earnings report, a move that says more about market psychology than it does about the company’s fundamentals.
The numbers were good. The reaction wasn’t.
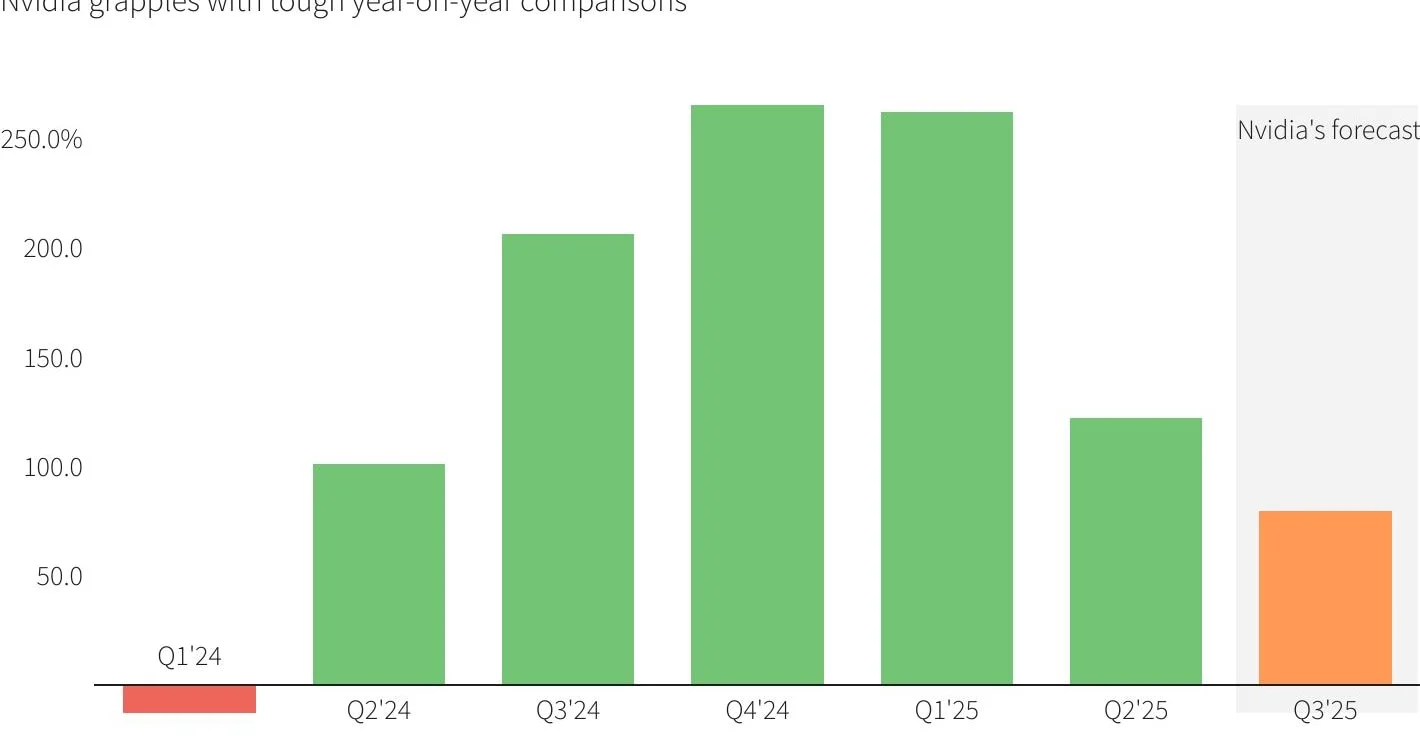
Here’s the thing about Nvidia’s quarter: by any normal standard, it was excellent. Revenue came in at roughly $51.2 billion, powered overwhelmingly by data center sales. The company’s forward guidance pointed to approximately $57 billion for the next quarter, a figure that would represent continued acceleration in a business already growing at a pace most companies can only dream about.
Nvidia also noted that its next-generation Blackwell GPUs are effectively sold out. That’s not a soft demand signal. That’s a company telling the market it literally cannot make chips fast enough to keep up with orders.
And yet the stock fell. The decline from its post-earnings peak ranged between 2% and as much as 6%, depending on the window you’re measuring. For a company with Nvidia’s market capitalization, that kind of move represents tens of billions of dollars in value evaporating in a matter of hours.
The reason is straightforward, even if it’s frustrating for bulls: when a stock is priced for perfection, merely excellent results don’t cut it. Nvidia needed to not just beat expectations but obliterate them with enough force to justify a valuation that already bakes in years of explosive growth. It beat expectations. It didn’t obliterate them.
Profit-taking meets AI anxiety
Part of the sell-off comes down to simple mechanics. Nvidia shares had rallied significantly heading into earnings, a pattern that’s become almost ritualistic in the AI trade. Traders buy the rumor, and when the news lands, even good news becomes a convenient excuse to lock in gains.
But there’s something deeper at work here. The market is increasingly nervous about the sustainability of AI spending. Nvidia’s biggest customers, the hyperscale cloud providers and enterprise tech giants, have been pouring capital into GPU infrastructure at a rate that some analysts worry can’t continue indefinitely. The question isn’t whether AI demand is real. It obviously is. The question is whether the current pace of capital expenditure represents a new normal or a temporary sugar rush.
The news moving money, markets, and the world—before your day starts.
Daily. Free. Join 34,000+ readers across crypto, finance, and policy.
Management’s comments about Blackwell being sold out should theoretically ease those concerns. If customers are lining up for next-gen hardware before it’s even widely available, that suggests demand has legs. But markets have a habit of looking past what’s happening now and worrying about what might happen in two or three quarters.
There’s also the AI bubble narrative, which has gone from fringe concern to mainstream talking point. Every time Nvidia’s stock wobbles after strong earnings, it reinforces the idea that the AI trade might be getting ahead of itself. Whether that’s true or not is almost beside the point. Perception shapes price action, and the perception right now is that AI valuations are stretched.
Geopolitics add another layer of risk
Beyond the demand sustainability question, Nvidia faces a geopolitical headwind that isn’t going away anytime soon. The US-China relationship continues to cast a shadow over the company’s revenue projections, particularly for 2025 and beyond.
China was once a significant market for Nvidia’s high-end chips. Export restrictions have already curtailed that business, and the regulatory landscape remains unpredictable. Any escalation in trade tensions could further compress Nvidia’s addressable market in the region, which is precisely the kind of risk that makes investors twitchy even when domestic and allied-nation demand looks strong.
This is the sort of overhang that doesn’t show up in quarterly earnings but absolutely factors into how investors price forward risk. A company can report perfect numbers today and still see its stock punished if the market decides tomorrow’s geopolitical environment is less favorable.
What this means for investors
The pattern of Nvidia pulling back 2% to 5% after strong earnings has become almost predictable. This is now the third or fourth time the company has beaten expectations only to see its stock trade lower in the immediate aftermath. That tells you something important: at current valuations, Nvidia’s earnings reports have become binary events where the bar is set unreasonably high.
For long-term investors, a 2% dip on a strong quarter probably isn’t cause for alarm. The underlying business is firing on all cylinders. Data center revenue continues to grow, next-gen products are oversubscribed, and the secular trend toward AI infrastructure spending shows no sign of reversing.
For traders and shorter-term holders, though, the volatility is the story. Nvidia has become a stock where the post-earnings move is almost as important as the earnings themselves. The competitive landscape is also worth watching closely. While Nvidia dominates the GPU market for AI training, competitors are investing heavily in custom silicon and alternative architectures. None of them pose an immediate threat to Nvidia’s market position, but the narrative of emerging competition gives bears ammunition every quarter.
The real risk for Nvidia isn’t that AI demand collapses overnight. It’s that the market’s expectations for growth simply outpace what any company, even one growing revenue at this clip, can realistically deliver. When you’re already priced as the most important company in the most important technology trend in a generation, the margin for error shrinks to almost nothing. And a 2% drop on a quarter this strong is proof of exactly that dynamic at work.
NVIDIA Corporation (NVDA) price
Full chart and statsLoading chart…
- Last close
- $146
- Close-to-close change
- −3.3%
- Market cap
- $3.5T (shares as of 2026-08-21)
- P/E (trailing)
- 18.5 (EPS to 2026-07-26)
- Annual revenue
- $215.9B USD (FY ended 2026-01-25) 10-K
- Annual revenue growth
- +65.5% (FY ended 2026-01-25 vs FY ended 2025-01-26) 10-K
- Annual net income
- 120,067,000,000 USD (FY ended 2026-01-25, attributable to the company) 10-K
- Annual operating margin
- 60.4% (FY ended 2026-01-25)
- Forward P/E
- Unavailable: no dated forecast source
Gloria daily close for session Nov 19, 2026. Market cap and trailing P/E use this close with the SEC share total and trailing diluted earnings, each dated next to its figure. Annual revenue, revenue growth, net income and margin show their own fiscal period and link the 10-K. Current context may postdate this article.
NVIDIA Corporation and its peers
| Company | Price | Market cap | P/E (trailing) | Forward P/E | Annual revenue (USD) | Annual revenue growth | Annual net income (USD) | Operating margin |
|---|---|---|---|---|---|---|---|---|
 NVIDIA Corporation
NVDA · Price dated Nov 19, 2026 · tokenized NVDAx |
$146 | $3.5T | 18.5 | Unavailable | $215.9BFY ended 2026-01-25 · 10-K | +65.5%FY ended 2026-01-25 vs 2025-01-26 · 10-K | 120,067,000,000FY ended 2026-01-25, attributable to the company · 10-K | 60.4%FY ended 2026-01-25 |
 Broadcom Inc.
AVGO · Price dated Nov 19, 2026 · tokenized AVGOx |
$347 | $1.7T | 44.2 | Unavailable | $63.9BFY ended 2025-11-02 · 10-K | +23.9%FY ended 2025-11-02 vs 2024-11-03 · 10-K | 23,126,000,000FY ended 2025-11-02, consolidated · 10-K | 39.9%FY ended 2025-11-02 |
 Advanced Micro Devices Inc.
AMD · Price dated Nov 19, 2026 · tokenized AMDx |
$489 | $802.3B | 106.1 | Unavailable | $34.6BFY ended 2025-12-27 · 10-K | +34.3%FY ended 2025-12-27 vs 2024-12-28 · 10-K | 4,335,000,000FY ended 2025-12-27, attributable to the company · 10-K | 10.7%FY ended 2025-12-27 |
 Micron Technology Inc.
MU · Price dated Nov 19, 2026 · tokenized MUx |
$690 | $781.2B | 9.3 | Unavailable | $133.2BFY ended 2026-09-03 · 10-K | +256.3%FY ended 2026-09-03 vs 2025-08-28 · 10-K | 84,969,000,000FY ended 2026-09-03, attributable to the company · 10-K | 74.6%FY ended 2026-09-03 |
Missing figures stay unavailable. Forward P/E requires a dated source. Annual revenue, revenue growth, net income and margin come from each company's own 10-K, in US dollars, and each row shows that fiscal year. Revenue growth compares the fiscal year with the prior year stated in the same 10-K. Net income is the full year amount attributable to the company, or available to common stockholders where the filing states only that, or consolidated net income. Each row names its basis. Trailing P/E reads "Not meaningful" when the dated trailing diluted EPS is a loss or zero. An operating margin appears only when the filing states both the operating income and the revenue for the same year.
Sources: SEC filings, Gloria daily closes and CoinGecko. Oldest record refresh: Nov 20, 2026, 6:51 AM EST. Refresh is not a price or filing date. Each row shows its price date and its annual fiscal period. Peers use industry code and company size, or editorial selection. Market cap multiplies that row price by the company share total the latest SEC filing states for every share class together. Trailing P/E divides it by trailing diluted earnings from SEC filings. Rolled earnings per share are approximate because share counts can change between periods. Both appear only when the SEC data carries its date, so they are estimates at one price date, not synchronized filing valuations. Not investment advice.
Traded on-chain
Explore tokenized products tracking NVIDIA Corporation. Open a product to see its price, network and observed pools. Access depends on the venue and where you live.
NVDAxBacked · Solana$135.98⌄
- Token price
- $135.98
- Issuer
- Backed
- Network
- Solana
Price from the pool with the highest reported reserves below. Token units may differ from one share.
Where to trade NVDAx
Pool liquidity- R Raydium CLMM NVDAx / USDC · 24h volume $3.8M $2.1M
- R Raydium CLMM NVDAx / SOL · 24h volume $712K $398K
- O Orca NVDAx / USDC · 24h volume $643K $310K
Source: GeckoTerminal. Retrieved Nov 20, 2026 17:15 UTC. Source and pools · Verify token contract Top three active pools by reported total reserves from the provider’s first 20 results. Each list covers this issuer, network and contract only. Products may have different share multipliers and rights. Pool reserves are not executable depth or guaranteed execution quality. Not a recommendation.
NVDAonOndo · BNB Chain$135.98⌄
- Token price
- $135.98
- Issuer
- Ondo
- Network
- BNB Chain
Price from the pool with the highest reported reserves below. Token units may differ from one share.
Where to trade NVDAon
Pool liquidity- P PancakeSwap V3 英伟达 / NVDAon 0.05% · 24h volume $3K $155K
- U Uniswap V4 Bsc NVDAon / 英伟达 0.038% · 24h volume $0 $68K
- P PancakeSwap V3 NVDAon / USDT 1% · 24h volume $2K $2K
Source: GeckoTerminal. Retrieved Nov 20, 2026 17:15 UTC. Source and pools · Verify token contract Top three active pools by reported total reserves from the provider’s first 20 results. Each list covers this issuer, network and contract only. Products may have different share multipliers and rights. Pool reserves are not executable depth or guaranteed execution quality. Not a recommendation.
NVDAonOndo · Ethereum$136.38⌄
- Token price
- $136.38
- Issuer
- Ondo
- Network
- Ethereum
Price from the pool with the highest reported reserves below. Token units may differ from one share.
Where to trade NVDAon
Pool liquidity- C Communityv3 NVDAon / USDC 2% · 24h volume $536K $1.6M
- C Communityv3 NVDAon / USDC 3% · 24h volume $104K $492K
- C Communityv3 NVDAon / USDC 1% · 24h volume $43K $118K
Source: GeckoTerminal. Retrieved Nov 20, 2026 17:15 UTC. Source and pools · Verify token contract Top three active pools by reported total reserves from the provider’s first 20 results. Each list covers this issuer, network and contract only. Products may have different share multipliers and rights. Pool reserves are not executable depth or guaranteed execution quality. Not a recommendation.
Disclosure: This article was edited by Editorial Team. For more information on how we create and review content, see our Editorial Policy.

