+65.5% (FY ended 2026-01-25 vs FY ended 2025-01-26) 10-K
Annual net income
120,067,000,000 USD (FY ended 2026-01-25, attributable to the company) 10-K
Annual operating margin
60.4% (FY ended 2026-01-25)
Forward P/E
Unavailable: no dated forecast source
Gloria daily close for session Oct 29, 2026. Market cap and trailing P/E use this close with the SEC share total and trailing diluted earnings, each dated next to its figure. Annual revenue, revenue growth, net income and margin show their own fiscal period and link the 10-K. Current context may postdate this article.
4,335,000,000FY ended 2025-12-27, attributable to the company · 10-K
10.7%FY ended 2025-12-27
Missing figures stay unavailable. Forward P/E requires a dated source. Annual revenue, revenue growth, net income and margin come from each company's own 10-K, in US dollars, and each row shows that fiscal year. Revenue growth compares the fiscal year with the prior year stated in the same 10-K. Net income is the full year amount attributable to the company, or available to common stockholders where the filing states only that, or consolidated net income. Each row names its basis. Trailing P/E reads "Not meaningful" when the dated trailing diluted EPS is a loss or zero. An operating margin appears only when the filing states both the operating income and the revenue for the same year.
Sources: SEC filings, Gloria daily closes and CoinGecko. Oldest record refresh: Oct 29, 2026, 1:52 PM EDT. Refresh is not a price or filing date. Each row shows its price date and its annual fiscal period. Peers use industry code and company size, or editorial selection. Market cap multiplies that row price by the company share total the latest SEC filing states for every share class together. Trailing P/E divides it by trailing diluted earnings from SEC filings. Rolled earnings per share are approximate because share counts can change between periods. Both appear only when the SEC data carries its date, so they are estimates at one price date, not synchronized filing valuations. Not investment advice.
Token vs underlying stock
Current comparison for NVDA. Historical observations may postdate this article.
Split-adjusted regular-session stock closes from the existing Gloria shared history, paired only with an observed token price within 45 minutes of 16:00 New York time. Up to 60 matched sessions. No interpolation or missing-date fill. Weekends and known early closes are omitted. Token units are not adjusted for issuer multipliers or dividend treatment. This compares quoted prices, not fair value, executable premiums or arbitrage returns. Solid line: token. Dashed line: stock. Exact quote times and values appear below. Historical observations. Retrieval refers to the token source. Token quote times use UTC. The fixed cohort shows its oldest member fetch.
Nvidia token vs Nvidia stock: exact source values
Date (UTC)
Token (USD)
Stock close (USD)
Token quote (UTC)
2026-08-06
219.15
218.99
2026-08-06 20:00
2026-08-07
223.93
223.96
2026-08-07 20:00
2026-08-10
217.66
217.55
2026-08-10 20:00
2026-08-11
217.53
217.50
2026-08-11 20:00
2026-08-12
224.12
224.09
2026-08-12 20:00
2026-08-13
225.42
225.30
2026-08-13 20:00
2026-08-14
225.34
225.16
2026-08-14 20:00
2026-08-17
225.13
225.01
2026-08-17 20:00
2026-08-18
219.70
219.74
2026-08-18 20:00
2026-08-19
217.76
217.56
2026-08-19 20:00
2026-08-20
216.79
216.85
2026-08-20 20:00
2026-08-21
214.85
214.72
2026-08-21 20:00
2026-08-24
208.75
208.48
2026-08-24 20:00
2026-08-25
213.16
213.05
2026-08-25 20:00
2026-08-26
210.06
209.66
2026-08-26 20:00
2026-08-27
227.96
227.98
2026-08-27 20:00
2026-08-28
217.74
217.55
2026-08-28 20:00
2026-08-31
220.91
220.78
2026-08-31 20:00
2026-09-01
217.58
217.44
2026-09-01 20:00
2026-09-02
224.46
224.41
2026-09-02 20:00
2026-09-03
228.90
228.45
2026-09-03 20:00
2026-09-04
230.35
230.36
2026-09-04 20:00
2026-09-08
225.69
225.73
2026-09-08 20:00
2026-09-09
223.89
223.67
2026-09-09 20:00
2026-09-10
218.70
218.36
2026-09-10 20:00
2026-09-11
218.92
218.29
2026-09-11 20:00
2026-09-14
211.47
210.96
2026-09-14 20:00
2026-09-15
212.34
212.17
2026-09-15 20:00
2026-09-16
214.25
213.90
2026-09-16 20:00
2026-09-17
219.68
219.34
2026-09-17 20:00
2026-09-18
222.24
222.27
2026-09-18 20:00
2026-09-21
227.69
227.38
2026-09-21 20:00
2026-09-22
229.20
228.87
2026-09-22 20:00
2026-09-23
225.44
225.51
2026-09-23 20:00
2026-09-24
224.87
224.58
2026-09-24 20:00
2026-09-25
225.29
225.07
2026-09-25 20:00
2026-09-28
228.97
228.86
2026-09-28 20:00
2026-09-29
227.95
227.21
2026-09-29 20:00
2026-09-30
229.85
228.38
2026-09-30 20:00
2026-10-01
231.18
230.86
2026-10-01 20:00
2026-10-02
234.38
233.95
2026-10-02 20:00
2026-10-05
239.30
238.90
2026-10-05 20:00
2026-10-06
239.71
239.24
2026-10-06 20:00
2026-10-07
237.80
237.47
2026-10-07 20:00
2026-10-08
230.81
230.48
2026-10-08 20:00
2026-10-09
229.70
229.28
2026-10-09 20:00
2026-10-12
226.87
226.32
2026-10-12 20:00
2026-10-13
228.73
228.52
2026-10-13 20:00
2026-10-14
221.56
221.30
2026-10-14 20:00
2026-10-15
217.48
217.23
2026-10-15 20:00
2026-10-16
214.56
214.13
2026-10-16 20:00
2026-10-19
217.41
217.09
2026-10-19 20:00
2026-10-20
216.69
216.47
2026-10-20 20:00
2026-10-21
222.20
221.97
2026-10-21 20:00
2026-10-22
212.42
212.21
2026-10-22 20:00
2026-10-23
211.27
210.96
2026-10-23 20:00
2026-10-26
216.15
216.00
2026-10-26 20:00
2026-10-27
218.06
217.94
2026-10-27 20:00
2026-10-28
215.40
215.38
2026-10-28 20:00
2026-10-29
213.57
213.66
2026-10-29 20:00
Stock history: Gloria · Retrieved Oct 30, 00:32 UTC. Token history: CoinGecko NVDAx.
Quoted token and share units can have different rights, multipliers and dividend treatment. This is not an executable premium or arbitrage signal.
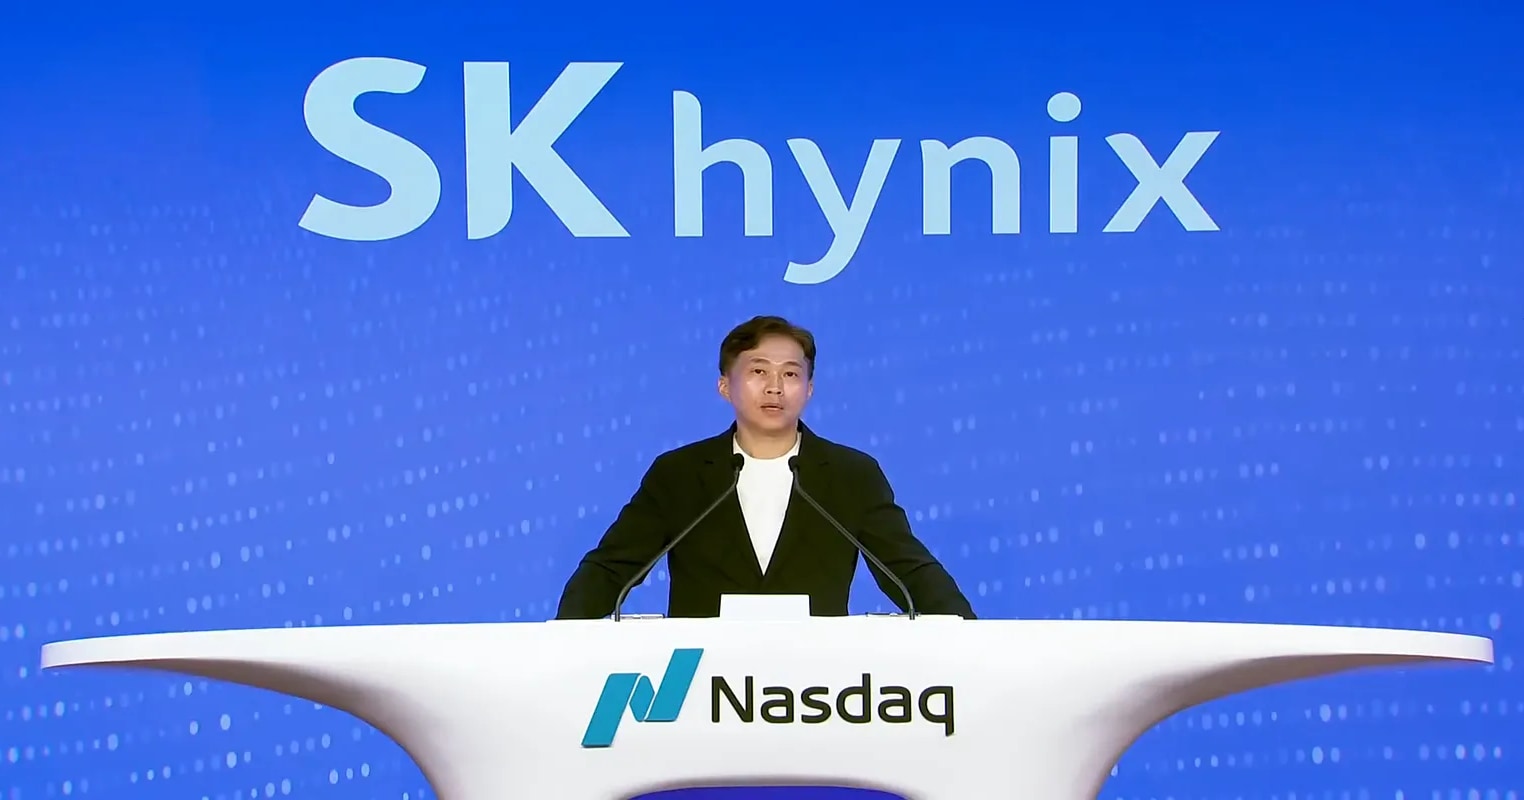
SK Hynix just landed on Nasdaq with the subtlety of a meteor. The South Korean memory chip giant’s American depositary receipts began trading under ticker SKHY on July 10, and retail traders are already circling the options market like sharks who just smelled blood in the water.
The company’s $26.5 billion US share offering was more than 7 times oversubscribed.
Why retail traders care about memory chips
Here’s the thing about SK Hynix: it’s not some speculative AI play riding vibes and a slick pitch deck. The company controls roughly 56.4% of the global high-bandwidth memory market by revenue. HBM, for the uninitiated, is the specialized memory that AI accelerators need to function. Think of it as the fuel that makes NVIDIA’s GPUs actually useful.
NVIDIA is one of SK Hynix’s primary customers for these HBM chips. That relationship alone makes SKHY a proxy bet on the entire AI hardware supply chain, which is exactly why retail traders are salivating over the upcoming options launch.
US options on SKHY are expected to begin trading around July 14, roughly two business days after the stock’s debut.
AI, tech, and the markets they move—in one daily briefing.
Daily. Free. Join 34,000+ readers across crypto, finance, and policy.
The supply chain angle that crypto watchers should note
SK Hynix has sold out its HBM production through at least 2028. That’s not a typo. The company has locked in long-term contracts that essentially guarantee years of revenue, but also mean the supply squeeze isn’t going away anytime soon.
What this means for investors
The 7x oversubscription on SK Hynix’s offering tells a clear story about market sentiment. Investors, both institutional and retail, are willing to pay up for direct exposure to AI hardware providers.
The options market will likely see heavy volume from day one. Retail traders have shown a consistent pattern of gravitating toward high-implied-volatility names in the AI space, and a freshly listed ADR with this kind of backstory is catnip for that crowd.
The risk, as always, is that retail enthusiasm outpaces fundamentals. A 56% market share is formidable, but the memory chip business is cyclical, and long-term contracts can become liabilities if demand shifts or next-generation architectures reduce HBM requirements.
Disclosure: This article was edited by Editorial Team. For more information on how we create and review content, see our Editorial Policy.