Salesforce shares sink on soft revenue outlook amid AI concerns
CRM stock dropped nearly 8% after the enterprise software giant delivered a disappointing revenue forecast, raising fresh questions about whether its AI bets are paying off.
Salesforce Inc. (CRM) price
Full chart and statsLoading chart…
- Last close
- $242
- Close-to-close change
- +0.5%
- Market cap
- $199.3B (shares as of 2026-08-20)
- P/E (trailing)
- 22.2 (EPS to 2026-07-31)
- Annual revenue
- $41.5B USD (FY ended 2026-01-31) 10-K
- Annual revenue growth
- +9.6% (FY ended 2026-01-31 vs FY ended 2025-01-31) 10-K
- Annual net income
- 7,457,000,000 USD (FY ended 2026-01-31, attributable to the company) 10-K
- Annual operating margin
- 20.1% (FY ended 2026-01-31)
- Forward P/E
- Unavailable: no dated forecast source
Gloria daily close for session Oct 28, 2026. Market cap and trailing P/E use this close with the SEC share total and trailing diluted earnings, each dated next to its figure. Annual revenue, revenue growth, net income and margin show their own fiscal period and link the 10-K. Current context may postdate this article.
Salesforce Inc. and its peers
| Company | Price | Market cap | P/E (trailing) | Forward P/E | Annual revenue (USD) | Annual revenue growth | Annual net income (USD) | Operating margin |
|---|---|---|---|---|---|---|---|---|
|
|
$242 | $199.3B | 22.2 | Unavailable | $41.5BFY ended 2026-01-31 · 10-K | +9.6%FY ended 2026-01-31 vs 2025-01-31 · 10-K | 7,457,000,000FY ended 2026-01-31, attributable to the company · 10-K | 20.1%FY ended 2026-01-31 |
|
|
$168 | Unavailable | 113.7 | Unavailable | $11.6BFY ended 2025-12-31 · 10-K | +30.1%FY ended 2025-12-31 vs 2024-12-31 · 10-K | 1,231,000,000FY ended 2025-12-31, attributable to the company · 10-K | 12.7%FY ended 2025-12-31 |
|
|
$150 | $155.8B | 108.0 | Unavailable | $13.3BFY ended 2025-12-31 · 10-K | +20.9%FY ended 2025-12-31 vs 2024-12-31 · 10-K | 1,748,000,000FY ended 2025-12-31, attributable to the company · 10-K | 13.7%FY ended 2025-12-31 |
|
|
$267 | $273.0B | Not meaningfulLoss, diluted EPS −0.45 to 2026-07-31 · SEC filing | Unavailable | $4.8BFY ended 2026-01-31 · 10-K | +21.7%FY ended 2026-01-31 vs 2025-01-31 · 10-K | −162,502,000FY ended 2026-01-31, attributable to the company · 10-K | −6.1%FY ended 2026-01-31 |

Missing figures stay unavailable. Forward P/E requires a dated source. Annual revenue, revenue growth, net income and margin come from each company's own 10-K, in US dollars, and each row shows that fiscal year. Revenue growth compares the fiscal year with the prior year stated in the same 10-K. Net income is the full year amount attributable to the company, or available to common stockholders where the filing states only that, or consolidated net income. Each row names its basis. Trailing P/E reads "Not meaningful" when the dated trailing diluted EPS is a loss or zero. An operating margin appears only when the filing states both the operating income and the revenue for the same year.
Sources: SEC filings, Gloria daily closes and CoinGecko. Oldest record refresh: Oct 28, 2026, 3:36 PM EDT. Refresh is not a price or filing date. Each row shows its price date and its annual fiscal period. Peers use industry code and company size, or editorial selection. Market cap multiplies that row price by the company share total the latest SEC filing states for every share class together. Trailing P/E divides it by trailing diluted earnings from SEC filings. Rolled earnings per share are approximate because share counts can change between periods. Both appear only when the SEC data carries its date, so they are estimates at one price date, not synchronized filing valuations. Not investment advice.
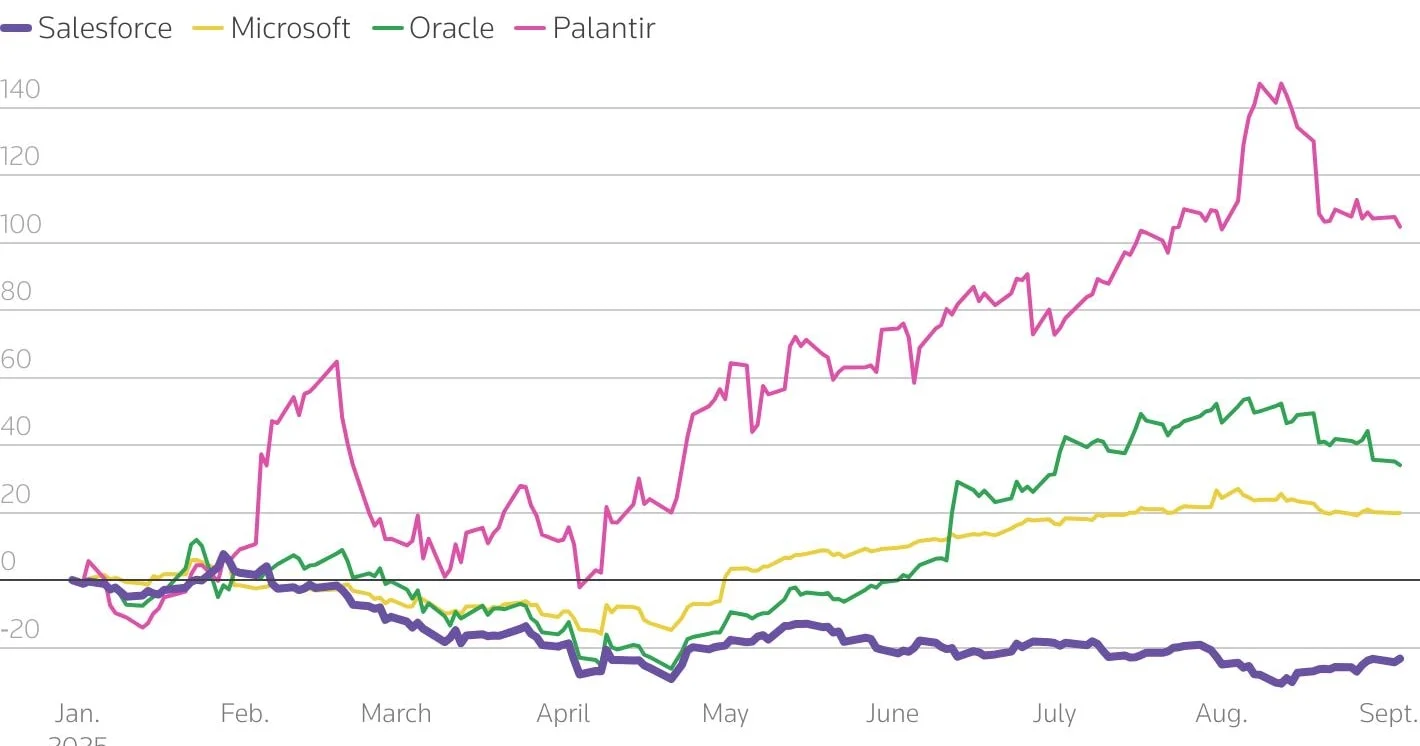
Salesforce just reminded Wall Street that spending billions on AI doesn’t automatically translate into revenue growth. Shares of the enterprise software giant fell nearly 8% on September 4, 2025, after the company issued a soft revenue outlook for its third quarter of fiscal year 2026.
What happened and why investors bailed
The nearly 8% single-session decline came during the aftermath of Salesforce’s earnings release, where the revenue guidance fell short of what analysts were expecting.
Salesforce has been aggressively marketing its AI capabilities, particularly through its Agentforce platform for autonomous agents and its Einstein AI suite. The pitch to customers is compelling on paper: let AI handle more of the repetitive CRM work so your sales team can focus on closing deals.
But investors are increasingly asking a pointed question. If autonomous AI agents can do much of what Salesforce’s traditional software does, why would enterprises keep paying premium subscription fees for legacy platforms?
The bigger picture: macro headwinds meet AI skepticism
This wasn’t Salesforce’s first rough encounter with Wall Street in 2025. Back in May, the company released its Q1 FY25 results to a decidedly mixed reception. Analysts noted that while the company beat some expectations, the broader macroeconomic environment was creating headwinds that made sustained growth harder to achieve.
The news moving money, markets, and the world—before your day starts.
Daily. Free. Join 34,000+ readers across crypto, finance, and policy.
By February 25, 2026, when Salesforce published its Q4 FY26 results, the company attempted to reset the narrative. Management projected FY27 revenue between $45.8 billion and $46.2 billion, representing a 10-11% annual increase. Part of that anticipated growth was attributed to contributions from Informatica, along with hopes for an organic recovery in the second half of FY27.
What this means for investors
Salesforce’s Agentforce and Einstein platforms represent genuine technological bets, but the monetization timeline remains unclear. The company is essentially asking shareholders to be patient while it builds out AI capabilities that may take several quarters to show up meaningfully in the top line.
For investors tracking this space, the key metrics to watch in coming quarters are Agentforce adoption rates, net revenue retention, and whether that projected $45.8-$46.2 billion FY27 revenue range holds up as guidance gets updated. The 10-11% growth target is respectable but not spectacular for a company commanding enterprise software valuations.
Disclosure: This article was edited by Editorial Team. For more information on how we create and review content, see our Editorial Policy.
More in Finance
See all-
Pendle posts first TVL gain in a year as real-world assets take over
-
Alipay denies supporting crypto trading via third-party platforms
-
London Metal Exchange explores tokenizing Hong Kong warehouse metal for financing
-
Utah files criminal gambling charges against Kalshi and its co-founders
-
London Metal Exchange explores tokenizing off-warrant metal to boost revenue
-
CFTC to host public roundtable on 24/7 derivatives trading on Dec. 15