Tesla’s $1T pay package for Musk hinges on sixfold stock growth to $8.5T market cap
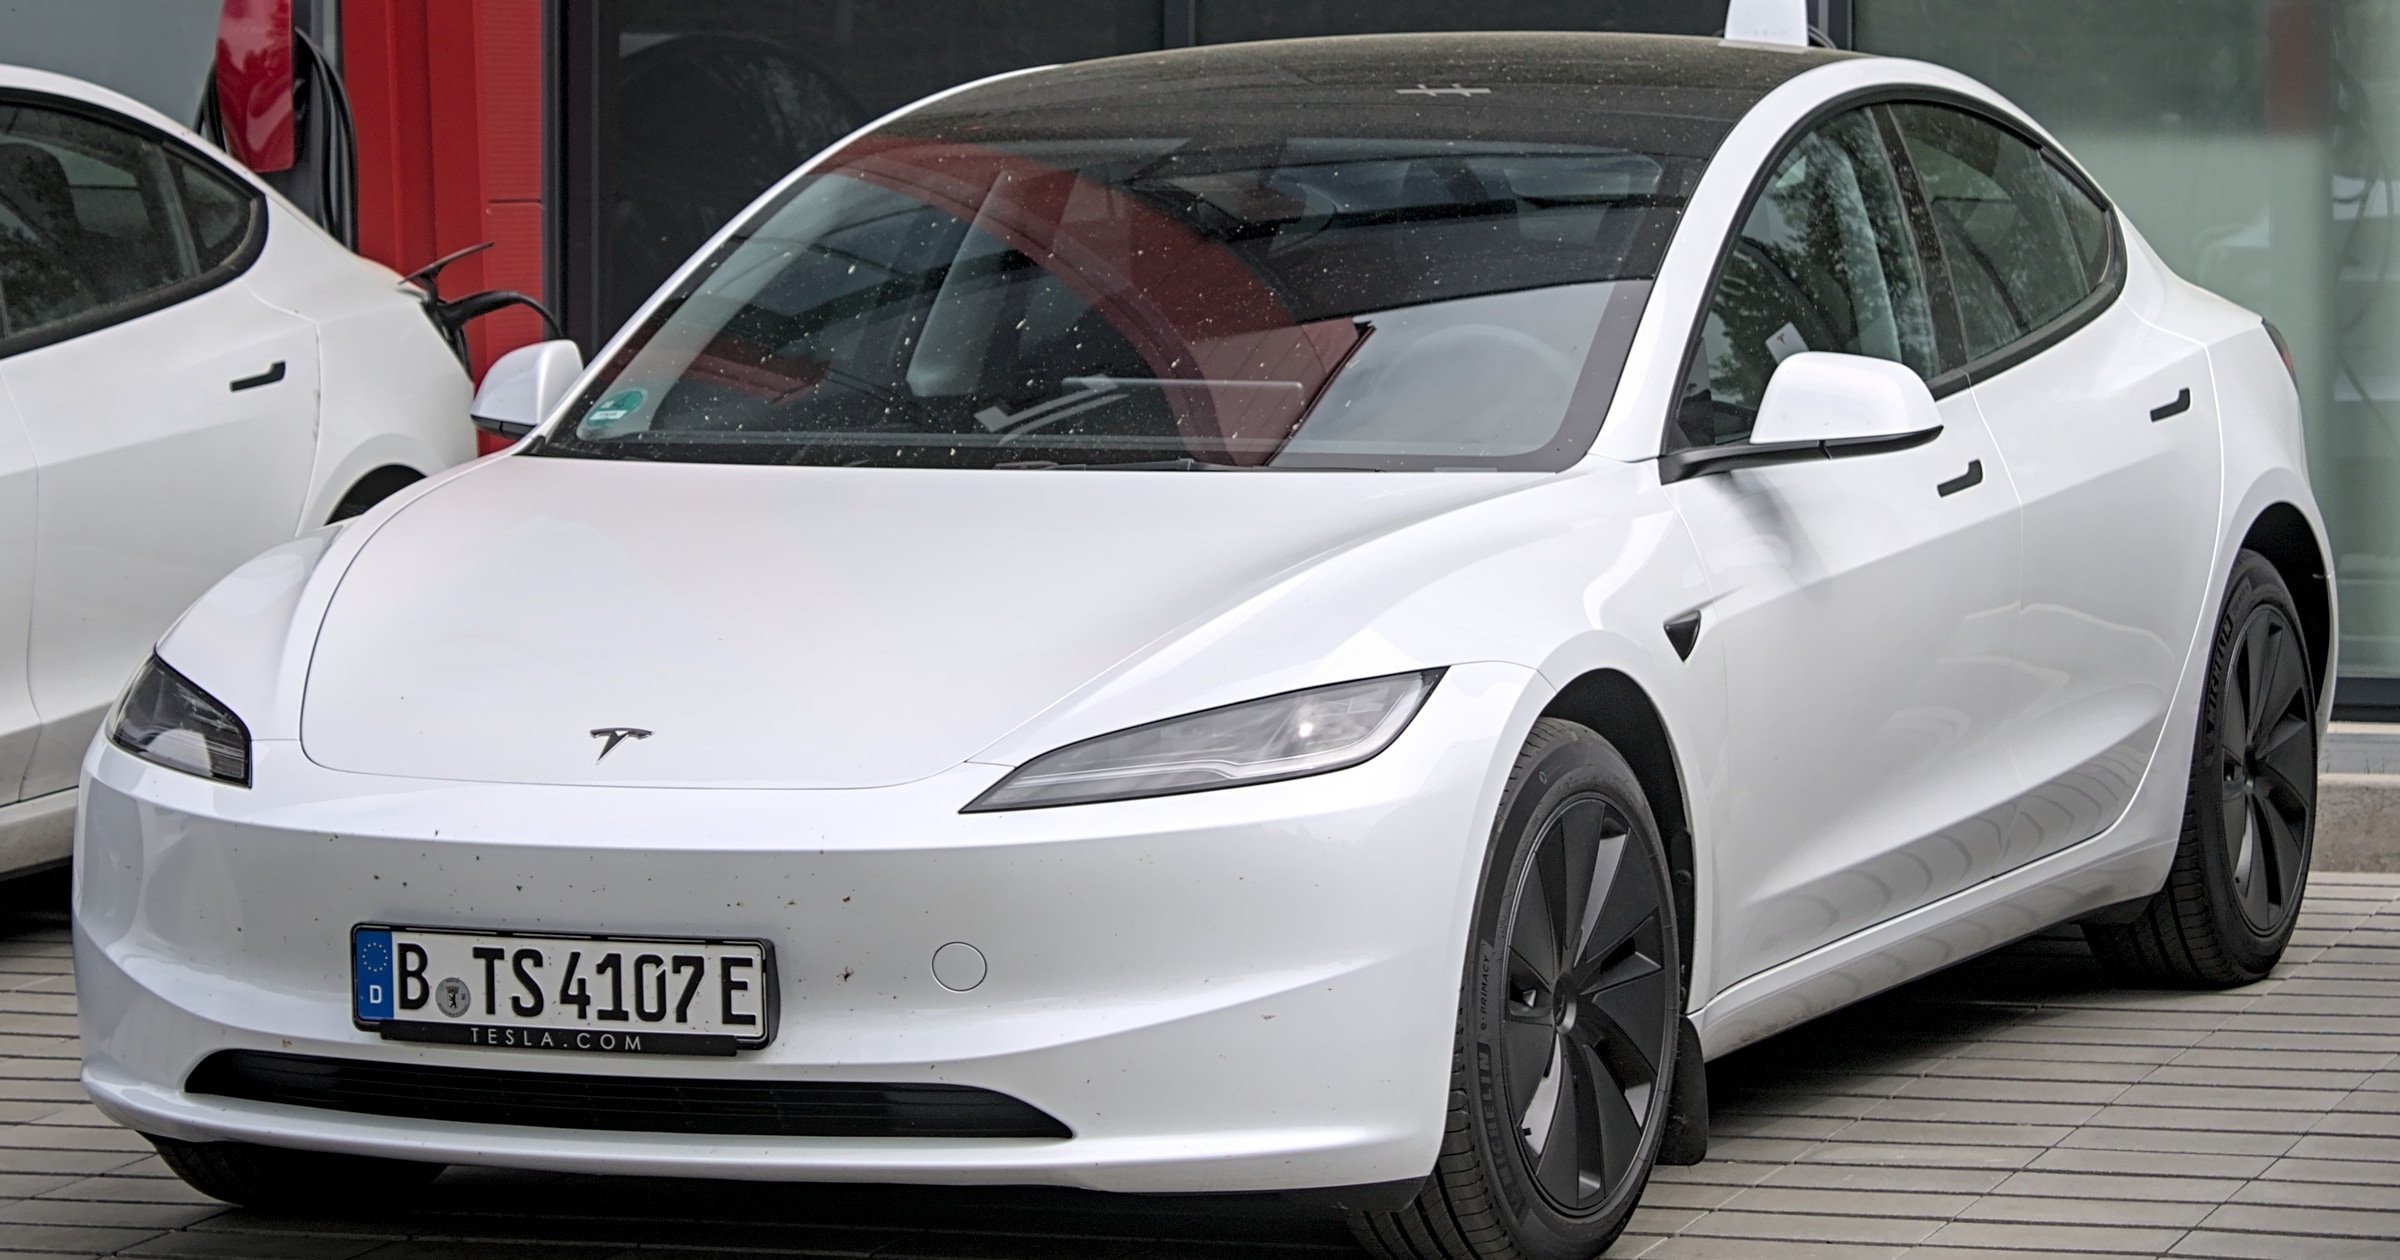
Photo: Alexander-93 / Wikimedia Commons / CC BY-SA 4.0 (https://creativecommons.org/licenses/by-sa/4.0)
The performance-based compensation plan requires Tesla to become the most valuable company in human history by a wide margin, with implications that ripple into the crypto market Musk has long influenced.
−2.9% (FY ended 2025-12-31 vs FY ended 2024-12-31) 10-K
Annual net income
3,794,000,000 USD (FY ended 2025-12-31, attributable to the company) 10-K
Annual operating margin
4.6% (FY ended 2025-12-31)
Forward P/E
Unavailable: no dated forecast source
Gloria daily close for session Oct 27, 2026. Market cap and trailing P/E use this close with the SEC share total and trailing diluted earnings, each dated next to its figure. Annual revenue, revenue growth, net income and margin show their own fiscal period and link the 10-K. Current context may postdate this article.
Tesla Inc. and its peers
Company
Price
Market cap
P/E (trailing)
Forward P/E
Annual revenue (USD)
Annual revenue growth
Annual net income (USD)
Operating margin
Tesla Inc.
TSLA · Price dated Oct 27, 2026 · tokenized TSLAx
6,732,000,000FY ended 2025-12-31, attributable to the company · 10-K
10.5%FY ended 2025-12-31
Missing figures stay unavailable. Forward P/E requires a dated source. Annual revenue, revenue growth, net income and margin come from each company's own 10-K, in US dollars, and each row shows that fiscal year. Revenue growth compares the fiscal year with the prior year stated in the same 10-K. Net income is the full year amount attributable to the company, or available to common stockholders where the filing states only that, or consolidated net income. Each row names its basis. Trailing P/E reads "Not meaningful" when the dated trailing diluted EPS is a loss or zero. An operating margin appears only when the filing states both the operating income and the revenue for the same year.
Sources: SEC filings, Gloria daily closes, CoinGecko and Databento. Oldest record refresh: Oct 27, 2026, 8:26 PM EDT. Refresh is not a price or filing date. Each row shows its price date and its annual fiscal period. Peers use industry code and company size, or editorial selection. Market cap multiplies that row price by the company share total the latest SEC filing states for every share class together. Trailing P/E divides it by trailing diluted earnings from SEC filings. Rolled earnings per share are approximate because share counts can change between periods. Both appear only when the SEC data carries its date, so they are estimates at one price date, not synchronized filing valuations. Not investment advice.
Token vs underlying stock
Current comparison for TSLA. Historical observations may postdate this article.
Split-adjusted regular-session stock closes from the existing Gloria shared history, paired only with an observed token price within 45 minutes of 16:00 New York time. Up to 60 matched sessions. No interpolation or missing-date fill. Weekends and known early closes are omitted. Token units are not adjusted for issuer multipliers or dividend treatment. This compares quoted prices, not fair value, executable premiums or arbitrage returns. Solid line: token. Dashed line: stock. Exact quote times and values appear below. Historical observations. Retrieval refers to the token source. Token quote times use UTC. The fixed cohort shows its oldest member fetch.
Tesla token vs Tesla stock: exact source values
Date (UTC)
Token (USD)
Stock close (USD)
Token quote (UTC)
2026-08-04
327.60
327.35
2026-08-04 20:00
2026-08-05
321.77
321.55
2026-08-05 20:00
2026-08-06
319.34
319.53
2026-08-06 20:00
2026-08-07
328.56
328.58
2026-08-07 20:00
2026-08-10
330.41
330.88
2026-08-10 20:00
2026-08-11
332.57
332.81
2026-08-11 20:00
2026-08-12
327.33
327.51
2026-08-12 20:00
2026-08-13
339.84
339.96
2026-08-13 20:00
2026-08-14
342.19
342.27
2026-08-14 20:00
2026-08-17
339.31
339.30
2026-08-17 20:00
2026-08-18
336.76
336.87
2026-08-18 20:00
2026-08-19
350.81
351.12
2026-08-19 20:00
2026-08-20
344.93
345.13
2026-08-20 20:00
2026-08-21
363.21
362.86
2026-08-21 20:00
2026-08-24
349.40
348.95
2026-08-24 20:00
2026-08-25
350.44
350.25
2026-08-25 20:00
2026-08-26
345.96
345.82
2026-08-26 20:00
2026-08-27
354.49
354.81
2026-08-27 20:00
2026-08-28
348.43
348.75
2026-08-28 20:00
2026-08-31
368.11
367.95
2026-08-31 20:00
2026-09-01
356.26
356.09
2026-09-01 20:00
2026-09-02
356.40
357.01
2026-09-02 20:00
2026-09-03
376.26
376.37
2026-09-03 20:00
2026-09-04
353.98
354.08
2026-09-04 20:00
2026-09-08
367.67
368.16
2026-09-08 20:00
2026-09-09
367.89
367.81
2026-09-09 20:00
2026-09-10
363.21
363.56
2026-09-10 20:00
2026-09-11
365.20
365.44
2026-09-11 20:00
2026-09-14
358.97
358.97
2026-09-14 20:00
2026-09-15
356.15
356.58
2026-09-15 20:00
2026-09-16
357.92
358.08
2026-09-16 20:00
2026-09-17
366.16
366.20
2026-09-17 20:00
2026-09-18
364.26
364.27
2026-09-18 20:00
2026-09-21
375.33
375.30
2026-09-21 20:00
2026-09-22
378.85
378.90
2026-09-22 20:00
2026-09-23
379.78
380.12
2026-09-23 20:00
2026-09-24
378.18
377.94
2026-09-24 20:00
2026-09-25
372.41
372.11
2026-09-25 20:00
2026-09-28
357.86
357.45
2026-09-28 20:00
2026-09-29
352.87
352.84
2026-09-29 20:00
2026-09-30
354.55
354.81
2026-09-30 20:00
2026-10-01
354.60
354.11
2026-10-01 20:00
2026-10-02
370.48
370.59
2026-10-02 20:00
2026-10-05
378.53
378.73
2026-10-05 20:00
2026-10-06
380.33
380.68
2026-10-06 20:00
2026-10-07
377.65
377.81
2026-10-07 20:00
2026-10-08
374.64
375.00
2026-10-08 20:00
2026-10-09
382.68
382.70
2026-10-09 20:00
2026-10-12
377.87
378.03
2026-10-12 20:00
2026-10-13
375.78
375.23
2026-10-13 20:00
2026-10-14
366.65
367.16
2026-10-14 20:00
2026-10-15
362.70
362.44
2026-10-15 20:00
2026-10-16
354.41
354.72
2026-10-16 20:00
2026-10-19
368.02
368.06
2026-10-19 20:00
2026-10-20
373.65
373.71
2026-10-20 20:00
2026-10-21
386.28
386.47
2026-10-21 20:00
2026-10-22
376.50
374.58
2026-10-22 20:00
2026-10-23
372.40
372.22
2026-10-23 20:00
2026-10-26
391.19
391.62
2026-10-26 20:00
2026-10-27
406.70
407.46
2026-10-27 20:00
Stock history: Gloria · Retrieved Oct 28, 00:50 UTC. Token history: CoinGecko TSLAx.
Quoted token and share units can have different rights, multipliers and dividend treatment. This is not an executable premium or arbitrage signal.
Tesla shareholders approved what might be the most audacious executive compensation plan ever conceived. Elon Musk’s new performance-based pay package could deliver up to $1 trillion in Tesla stock, but only if the company’s market cap balloons from roughly $1.2 trillion to $8.5 trillion. That’s not a typo.
The vote passed on November 6, 2025, with over 75% shareholder approval.
The milestones that stand between Musk and a trillion-dollar payday
The compensation structure spans 12 tranches, with market cap milestones that start rising in $500 billion increments before escalating to larger steps. In practical terms, Tesla needs to roughly 6x its current valuation for Musk to collect the full package, which would amount to approximately 423 to 424 million additional shares.
But market cap alone doesn’t unlock the vault. The operational targets are equally staggering: 20 million vehicle deliveries, 1 million robotaxis produced, 10 million Full Self-Driving subscriptions, and 1 million humanoid robots built.
Advertisement
As of August 2026, Tesla’s market cap sits at about $1.23 trillion. That means the company has covered roughly $100 billion of the $7 trillion-plus gap since the plan was proposed.
A regulatory filing from May 2026 valued the package at $158.4 billion based on projected 2025 performance. No shares had vested at that point. The plan also requires Musk to stick around for at least 7.5 years, potentially pushing his tenure requirement through roughly 2033.
AI, tech, and the markets they move—in one daily briefing.
Daily. Free. Join 34,000+ readers across crypto, finance, and policy.
If Musk hits every target, his ownership stake in Tesla would climb to approximately 25%.
Why the Delaware drama matters
This new package didn’t emerge in a vacuum. Musk’s previous 2018 compensation plan faced a bruising legal challenge in Delaware courts, where a judge voided it on grounds that the board approval process was flawed.
The November 2025 vote was, in many ways, a shareholder referendum on whether the 2018 debacle was a legitimate governance failure or judicial overreach. The 75%-plus approval margin suggests investors landed firmly in the latter camp.
The crypto connection: indirect but impossible to ignore
Tesla already accepts Dogecoin for certain merchandise purchases, a policy that has persisted as one of the more visible corporate crypto integrations in traditional markets. Musk’s relationship with DOGE specifically has made him one of the most influential figures in crypto.
For crypto market participants, the practical takeaway is straightforward. Musk’s compensation plan creates a powerful incentive for him to drive Tesla’s stock price higher over the next decade. Any major catalysts, whether it’s a robotaxi launch, a humanoid robot deployment, or a breakthrough in Full Self-Driving technology, will amplify his visibility and influence.
Disclosure: This article was edited by Editorial Team. For more information on how we create and review content, see our Editorial Policy.
AI, tech, and the markets they move—in one daily briefing.Daily. Free. Join 34,000+ readers across crypto, finance, and policy.
Free daily briefing
Crypto Briefing Pro
The news about what you hold
Follow your stocks and crypto. Read the news about them from hundreds of publishers in Pro.