Tesla misses profit forecasts, reports negative free cash flow as AI spending surges
Record revenue couldn't save Tesla from its first cash flow deficit in over two years, as the company bets big on robots and AI infrastructure
Tesla had a quarter that looked great on the top line and uncomfortable everywhere else. The company posted record revenue of $28.24B in Q2 2026, blew past analyst expectations, and delivered more cars than ever before. Then investors looked at the bottom of the income statement and started selling.
Adjusted earnings per share came in at $0.33, against Wall Street projections of $0.50 to $0.53. Free cash flow swung to negative $1.1B, the first deficit the company has recorded in over two years. Shares dropped more than 4% in after-hours trading.
What the numbers actually say
Start with the good news, because there is some. Vehicle deliveries hit 480,126 units in the quarter, a 25% increase year-over-year. Automotive revenue reached $20.52B, up 23% from the same period last year. The energy segment kept growing too, with storage deployments reaching 13.5 GWh.
Here’s the problem: profitability moved in the opposite direction. GAAP net income fell 5% year-over-year to $1.11B, and gross margins compressed to 16.8%. The company is selling more cars and making less money per car.
Free cash flow tells the starker story. In Q1 2026, Tesla generated $1.44B in free cash flow. In Q2 2025, it generated $146M. In Q2 2026, it burned $1.1B.
The culprit is capital expenditure. Tesla has raised its capex guidance for 2026 to over $25B, which is nearly three times what the company spent in 2025. That money is going toward AI infrastructure, robotics development, and the Optimus humanoid robot program.
AI, tech, and the markets they move—in one daily briefing.
Daily. Free. Join 34,000+ readers across crypto, finance, and policy.
The AI and robotics bet
Tesla framing itself as an AI and robotics company isn’t new, but the financial footprint of that ambition is getting harder to ignore. Optimus, the humanoid robot that CEO Elon Musk has positioned as a potential multi-trillion-dollar business, is absorbing significant capital investment. So is the broader AI infrastructure that powers Tesla’s autonomous driving systems.
Tesla is deliberately sacrificing near-term cash generation to fund long-term platform development. The market’s 4% after-hours drop suggests that for now, skepticism is winning the argument over optimism.
What this means for investors watching Tesla and tech
A negative $1.1B free cash flow figure against a capex plan of over $25B for the full year signals that this dynamic is going to persist. Tesla is not in financial distress, but it is in a period where the business is consuming capital rather than generating it.
Gross margin compression to 16.8% is also worth watching. For a company that once commanded margins well above 20%, the sustained pressure from price cuts and rising costs has left less buffer to absorb the kind of investment cycle Tesla is currently running.
The energy segment offers a counterpoint. Storage deployments at 13.5 GWh represent a business line that has been growing consistently and carries different margin dynamics than the automotive division.
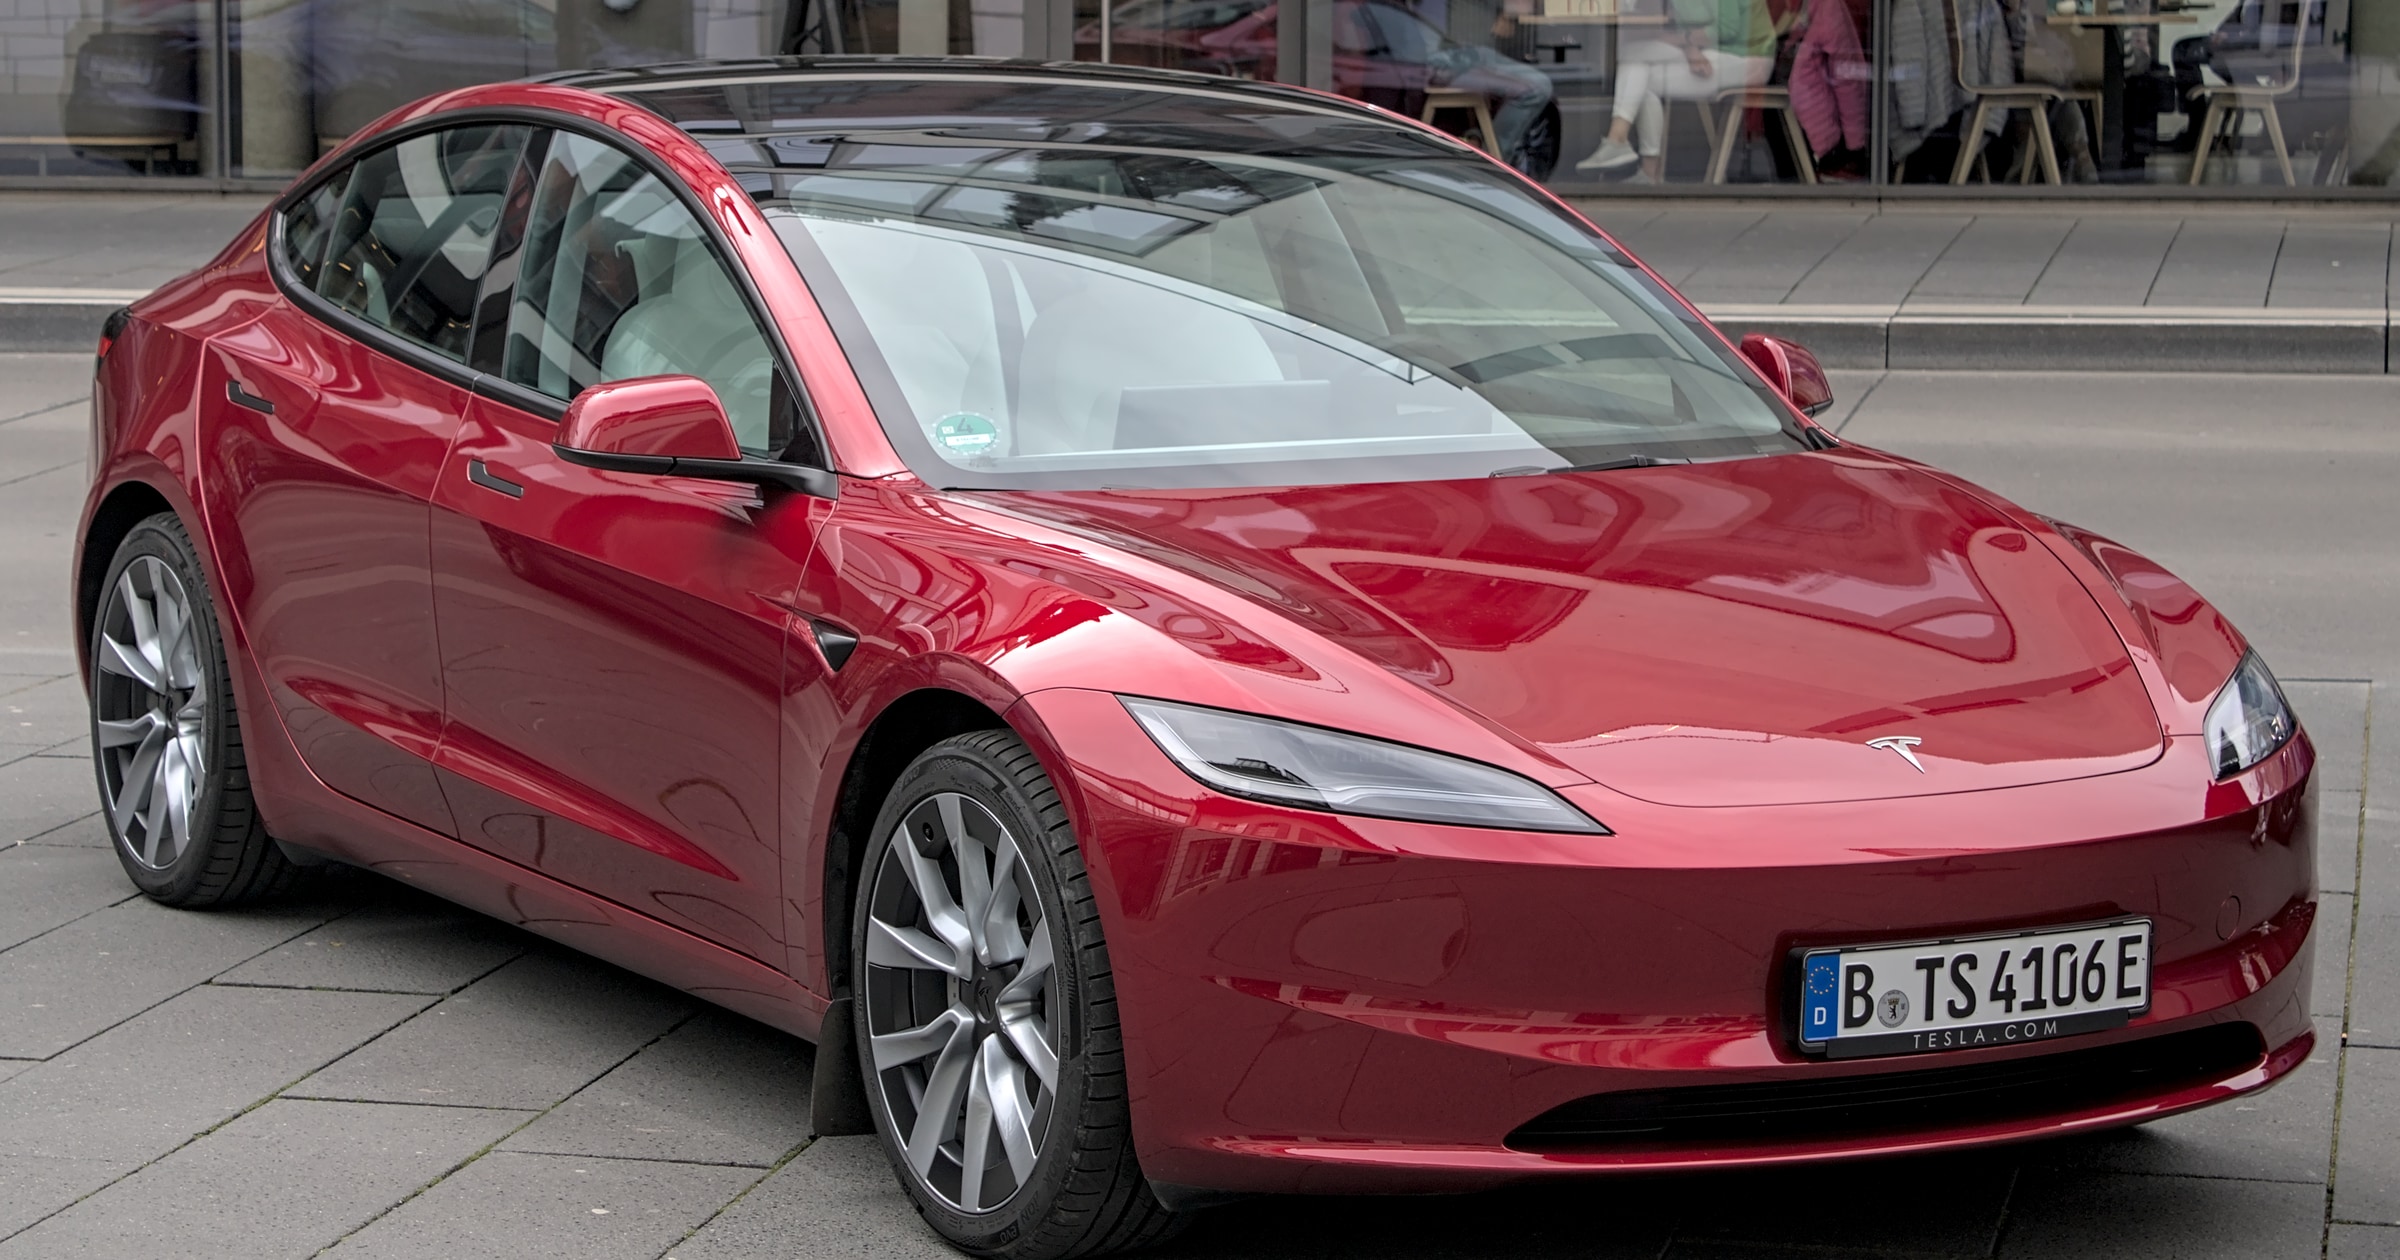
Tesla Inc. and its peers
| Company | Price | Market cap | P/E (trailing) | Forward P/E | Annual revenue (USD) | Annual revenue growth | Annual net income (USD) | Operating margin |
|---|---|---|---|---|---|---|---|---|
|
|
$390 | $1.5T | 428.8 | Unavailable | $94.8BFY ended 2025-12-31 · 10-K | −2.9%FY ended 2025-12-31 vs 2024-12-31 · 10-K | 3,794,000,000FY ended 2025-12-31, attributable to the company · 10-K | 4.6%FY ended 2025-12-31 |
|
|
$86 | $72.5B | 18.8 | Unavailable | $185.0BFY ended 2025-12-31 · 10-K | −1.3%FY ended 2025-12-31 vs 2024-12-31 · 10-K | 2,697,000,000FY ended 2025-12-31, attributable to the company · 10-K | 1.6%FY ended 2025-12-31 |
| F Ford Motor Co F · Price dated Nov 12, 2026 | $12 | $47.6B | Not meaningfulLoss, diluted EPS −1.98 to 2026-09-30 · SEC filing | Unavailable | $187.3BFY ended 2025-12-31 · 10-K | +1.2%FY ended 2025-12-31 vs 2024-12-31 · 10-K | −8,182,000,000FY ended 2025-12-31, available to common stockholders · 10-K | −4.9%FY ended 2025-12-31 |
| R Rivian Automotive, Inc. RIVN · Price dated Nov 12, 2026 | $13 | $18.7B | Not meaningfulLoss, diluted EPS −2.26 to 2026-09-30 · SEC filing | Unavailable | $5.4BFY ended 2025-12-31 · 10-K | +8.4%FY ended 2025-12-31 vs 2024-12-31 · 10-K | −3,646,000,000FY ended 2025-12-31, attributable to the company · 10-K | −66.5%FY ended 2025-12-31 |
Missing figures stay unavailable. Forward P/E requires a dated source. Annual revenue, revenue growth, net income and margin come from each company's own 10-K, in US dollars, and each row shows that fiscal year. Revenue growth compares the fiscal year with the prior year stated in the same 10-K. Net income is the full year amount attributable to the company, or available to common stockholders where the filing states only that, or consolidated net income. Each row names its basis. Trailing P/E reads "Not meaningful" when the dated trailing diluted EPS is a loss or zero. An operating margin appears only when the filing states both the operating income and the revenue for the same year.
Sources: SEC filings, Gloria daily closes, CoinGecko and Databento. Oldest record refresh: Nov 13, 2026, 12:56 PM EST. Refresh is not a price or filing date. Each row shows its price date and its annual fiscal period. Peers use industry code and company size, or editorial selection. Market cap multiplies that row price by the company share total the latest SEC filing states for every share class together. Trailing P/E divides it by trailing diluted earnings from SEC filings. Rolled earnings per share are approximate because share counts can change between periods. Both appear only when the SEC data carries its date, so they are estimates at one price date, not synchronized filing valuations. Not investment advice.
Disclosure: This article was edited by Editorial Team. For more information on how we create and review content, see our Editorial Policy.


