+12.4% (FY ended 2025-12-31 vs FY ended 2024-12-31) 10-K
Annual net income
77,670,000,000 USD (FY ended 2025-12-31, attributable to the company) 10-K
Annual operating margin
11.2% (FY ended 2025-12-31)
Forward P/E
Unavailable: no dated forecast source
Gloria daily close for session Oct 29, 2026. Market cap and trailing P/E use this close with the SEC share total and trailing diluted earnings, each dated next to its figure. Annual revenue, revenue growth, net income and margin show their own fiscal period and link the 10-K. Current context may postdate this article.
Amazon.com Inc. and its peers
Company
Price
Market cap
P/E (trailing)
Forward P/E
Annual revenue (USD)
Annual revenue growth
Annual net income (USD)
Operating margin
Amazon.com Inc.
AMZN · Price dated Oct 29, 2026 · tokenized AMZNx
21,893,000,000FY ended 2026-01-31, attributable to the company · 10-K
4.2%FY ended 2026-01-31
Missing figures stay unavailable. Forward P/E requires a dated source. Annual revenue, revenue growth, net income and margin come from each company's own 10-K, in US dollars, and each row shows that fiscal year. Revenue growth compares the fiscal year with the prior year stated in the same 10-K. Net income is the full year amount attributable to the company, or available to common stockholders where the filing states only that, or consolidated net income. Each row names its basis. Trailing P/E reads "Not meaningful" when the dated trailing diluted EPS is a loss or zero. An operating margin appears only when the filing states both the operating income and the revenue for the same year.
Sources: SEC filings, Gloria daily closes and CoinGecko. Oldest record refresh: Oct 29, 2026, 11:51 AM EDT. Refresh is not a price or filing date. Each row shows its price date and its annual fiscal period. Peers use industry code and company size, or editorial selection. Market cap multiplies that row price by the company share total the latest SEC filing states for every share class together. Trailing P/E divides it by trailing diluted earnings from SEC filings. Rolled earnings per share are approximate because share counts can change between periods. Both appear only when the SEC data carries its date, so they are estimates at one price date, not synchronized filing valuations. Not investment advice.
Token vs underlying stock
Current comparison for AMZN. Historical observations may postdate this article.
Split-adjusted regular-session stock closes from the existing Gloria shared history, paired only with an observed token price within 45 minutes of 16:00 New York time. Up to 60 matched sessions. No interpolation or missing-date fill. Weekends and known early closes are omitted. Token units are not adjusted for issuer multipliers or dividend treatment. This compares quoted prices, not fair value, executable premiums or arbitrage returns. Solid line: token. Dashed line: stock. Exact quote times and values appear below. Historical observations. Retrieval refers to the token source. Token quote times use UTC. The fixed cohort shows its oldest member fetch.
Amazon token vs Amazon stock: exact source values
Date (UTC)
Token (USD)
Stock close (USD)
Token quote (UTC)
2026-08-06
272.13
272.26
2026-08-06 20:00
2026-08-07
274.76
274.48
2026-08-07 20:00
2026-08-10
277.96
278.09
2026-08-10 20:00
2026-08-11
272.21
272.27
2026-08-11 20:00
2026-08-12
267.48
267.28
2026-08-12 20:00
2026-08-13
265.07
265.13
2026-08-13 20:00
2026-08-14
262.81
262.65
2026-08-14 20:00
2026-08-17
261.07
261.31
2026-08-17 20:00
2026-08-18
259.40
259.45
2026-08-18 20:00
2026-08-19
265.80
265.84
2026-08-19 20:00
2026-08-20
259.95
260.11
2026-08-20 20:00
2026-08-21
258.73
258.63
2026-08-21 20:00
2026-08-24
262.28
262.07
2026-08-24 20:00
2026-08-25
261.06
261.06
2026-08-25 20:00
2026-08-26
260.32
260.28
2026-08-26 20:00
2026-08-27
256.30
256.26
2026-08-27 20:00
2026-08-28
266.44
266.43
2026-08-28 20:00
2026-08-31
259.63
259.77
2026-08-31 20:00
2026-09-01
254.64
254.92
2026-09-01 20:00
2026-09-02
254.81
254.98
2026-09-02 20:00
2026-09-03
258.83
258.90
2026-09-03 20:00
2026-09-04
258.34
258.51
2026-09-04 20:00
2026-09-08
256.81
256.97
2026-09-08 20:00
2026-09-09
252.24
252.40
2026-09-09 20:00
2026-09-10
251.61
251.89
2026-09-10 20:00
2026-09-11
257.13
256.78
2026-09-11 20:00
2026-09-14
253.68
253.54
2026-09-14 20:00
2026-09-15
248.35
248.42
2026-09-15 20:00
2026-09-16
246.01
245.96
2026-09-16 20:00
2026-09-17
251.35
251.19
2026-09-17 20:00
2026-09-18
253.69
253.71
2026-09-18 20:00
2026-09-21
258.31
258.45
2026-09-21 20:00
2026-09-22
255.06
254.98
2026-09-22 20:00
2026-09-23
249.39
249.27
2026-09-23 20:00
2026-09-24
249.48
249.38
2026-09-24 20:00
2026-09-25
249.71
249.67
2026-09-25 20:00
2026-09-28
246.30
246.15
2026-09-28 20:00
2026-09-29
246.66
246.67
2026-09-29 20:00
2026-09-30
249.53
249.15
2026-09-30 20:00
2026-10-01
248.17
248.23
2026-10-01 20:00
2026-10-02
251.37
251.52
2026-10-02 20:00
2026-10-05
251.43
251.40
2026-10-05 20:00
2026-10-06
256.28
256.29
2026-10-06 20:00
2026-10-07
259.85
259.92
2026-10-07 20:00
2026-10-08
254.31
254.06
2026-10-08 20:00
2026-10-09
262.35
262.43
2026-10-09 20:00
2026-10-12
259.60
259.53
2026-10-12 20:00
2026-10-13
258.72
258.58
2026-10-13 20:00
2026-10-14
253.89
254.08
2026-10-14 20:00
2026-10-15
254.89
254.76
2026-10-15 20:00
2026-10-16
250.16
250.00
2026-10-16 20:00
2026-10-19
262.52
262.45
2026-10-19 20:00
2026-10-20
262.57
262.63
2026-10-20 20:00
2026-10-21
262.57
262.37
2026-10-21 20:00
2026-10-22
250.30
250.38
2026-10-22 20:00
2026-10-23
248.07
248.00
2026-10-23 20:00
2026-10-26
248.95
249.09
2026-10-26 20:00
2026-10-27
253.41
253.10
2026-10-27 20:00
2026-10-28
254.56
254.60
2026-10-28 20:00
2026-10-29
244.37
243.79
2026-10-29 20:00
Stock history: Gloria · Retrieved Oct 30, 00:32 UTC. Token history: CoinGecko AMZNx.
Quoted token and share units can have different rights, multipliers and dividend treatment. This is not an executable premium or arbitrage signal.
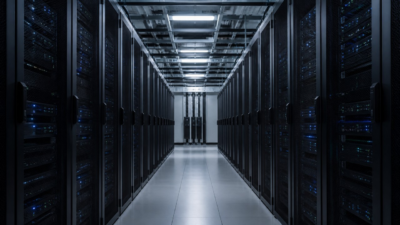
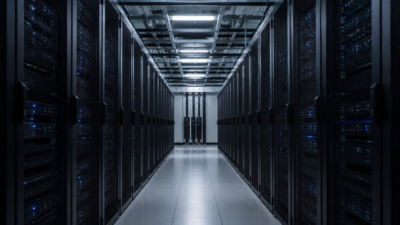
Nine companies are expected to spend about $1 trillion on capital expenditures this year. Most of that money is headed into AI data centers, plus the chips and networking gear that fill them.
Three names carry most of the weight. Amazon, Alphabet and Microsoft together account for roughly $590 billion of the total. That leaves the other six companies splitting what remains, which is still a very large check.
Who is spending what
Capital expenditures, or capex, are what companies spend on long-lasting physical assets. Think buildings, servers and equipment, rather than salaries or electricity bills. When a tech giant builds a data center, that cost lands in capex.
Amazon sits at the top of the list. The company is forecasting approximately $220 billion in capital expenditures for 2026. Part of that figure is attributed to rising memory-chip costs, so not every extra dollar buys extra capacity. Some of it just covers pricier parts.
Alphabet, Google’s parent company, has kept its capex guidance at $195 billion to $205 billion. It also reported a Google Cloud backlog of $561 billion. A backlog is business customers have committed to but the company hasn’t delivered yet. It works like a restaurant’s reservation book: the tables aren’t full tonight, but the bookings are already on paper.
That backlog figure matters. It gives Alphabet a concrete argument that the spending is chasing real demand, not just hope.
Microsoft went the other direction, at least slightly. The company lowered its 2026 spending forecast to about $170 billion, down from an earlier estimate of $175 billion.
AI, tech, and the markets they move—in one daily briefing.
Daily. Free. Join 34,000+ readers across crypto, finance, and policy.
Meta and Oracle round out the group of major US hyperscalers driving the surge. Hyperscalers are the companies that run cloud infrastructure at massive scale and rent computing power to everyone else.
How we got here
The current totals are larger than earlier projections suggested. The combined spending of Amazon, Alphabet, Microsoft and Meta was previously estimated at about $720 billion to $745 billion for 2026.
The longer-term outlook is bigger still. Projections indicate the five major US hyperscalers could exceed $1 trillion in annual capex from 2027 to 2030.
What this means
The obvious beneficiaries are the companies selling the picks and shovels. Chipmakers, memory suppliers, networking vendors and data center builders sit on the receiving end of this capex. Amazon’s note about memory-chip costs hints that suppliers already have pricing power.
For the spenders, the math is less comfortable. Concerns have emerged about whether this pace is sustainable, and three pressure points keep coming up.
The first is depreciation. When a company buys a server, it doesn’t expense the full cost at once. It spreads the cost over the asset’s useful life, and that charge hits earnings every year. Spend heavily now, and those charges pile up later, whether or not AI revenue keeps pace.
The second is energy. Data centers need enormous amounts of power, and building one is pointless if the grid can’t supply it.
The third is chip supply. Even with budgets approved, companies can only build as fast as suppliers can deliver. Supply chain constraints could push spending into later years or drive up prices, which appears to be part of Amazon’s story already.
Investors are effectively being asked to accept a trade. Spend now, earn later. Alphabet’s $561 billion cloud backlog is the strongest evidence on the table that later is real. Microsoft’s small forecast cut is a reminder that even the biggest buyers are watching the bill.
Disclosure: This article was edited by Diego Almada Lopez. For more information on how we create and review content, see our Editorial Policy.