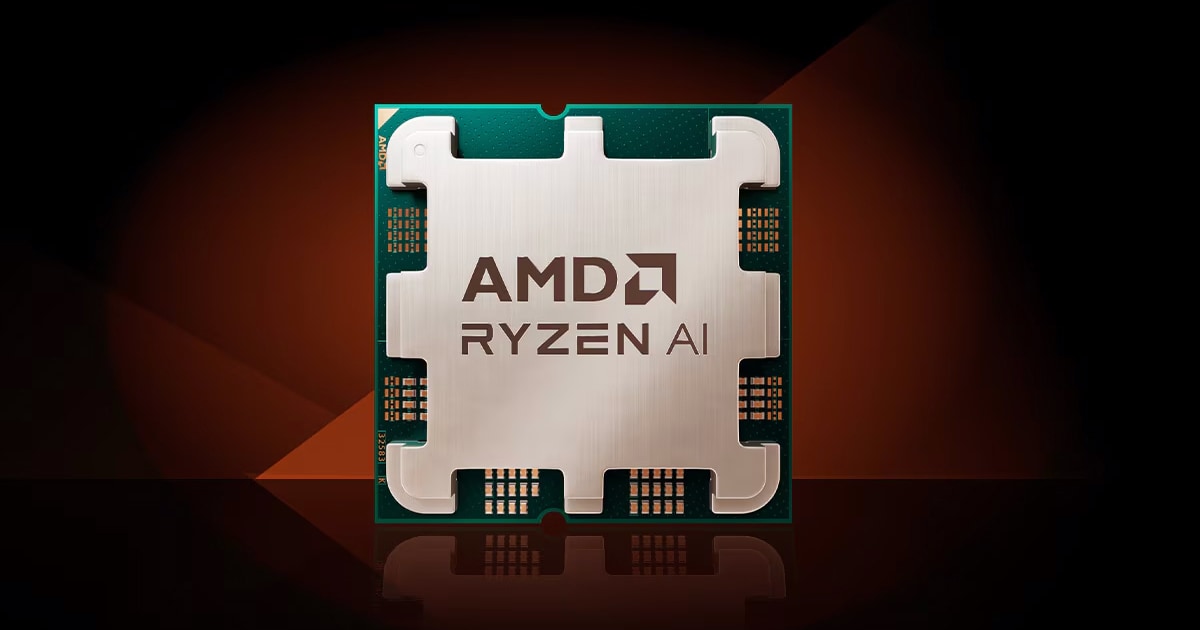
AMD enters a new AI growth phase, and crypto miners are paying attention
The chipmaker's aggressive AI infrastructure push is reshaping compute economics for everyone from data center operators to decentralized GPU networks.
+34.3% (FY ended 2025-12-27 vs FY ended 2024-12-28) 10-K
Annual net income
4,335,000,000 USD (FY ended 2025-12-27, attributable to the company) 10-K
Annual operating margin
10.7% (FY ended 2025-12-27)
Forward P/E
Unavailable: no dated forecast source
Gloria daily close for session Oct 28, 2026. Market cap and trailing P/E use this close with the SEC share total and trailing diluted earnings, each dated next to its figure. Annual revenue, revenue growth, net income and margin show their own fiscal period and link the 10-K. Current context may postdate this article.
−267,000,000FY ended 2025-12-27, attributable to the company · 10-K
−4.2%FY ended 2025-12-27
Missing figures stay unavailable. Forward P/E requires a dated source. Annual revenue, revenue growth, net income and margin come from each company's own 10-K, in US dollars, and each row shows that fiscal year. Revenue growth compares the fiscal year with the prior year stated in the same 10-K. Net income is the full year amount attributable to the company, or available to common stockholders where the filing states only that, or consolidated net income. Each row names its basis. Trailing P/E reads "Not meaningful" when the dated trailing diluted EPS is a loss or zero. An operating margin appears only when the filing states both the operating income and the revenue for the same year.
Sources: SEC filings, Gloria daily closes and CoinGecko. Oldest record refresh: Oct 28, 2026, 4:56 PM EDT. Refresh is not a price or filing date. Each row shows its price date and its annual fiscal period. Peers use industry code and company size, or editorial selection. Market cap multiplies that row price by the company share total the latest SEC filing states for every share class together. Trailing P/E divides it by trailing diluted earnings from SEC filings. Rolled earnings per share are approximate because share counts can change between periods. Both appear only when the SEC data carries its date, so they are estimates at one price date, not synchronized filing valuations. Not investment advice.
Token vs underlying stock
Current comparison for AMD. Historical observations may postdate this article.
Split-adjusted regular-session stock closes from the existing Gloria shared history, paired only with an observed token price within 45 minutes of 16:00 New York time. Up to 60 matched sessions. No interpolation or missing-date fill. Weekends and known early closes are omitted. Token units are not adjusted for issuer multipliers or dividend treatment. This compares quoted prices, not fair value, executable premiums or arbitrage returns. Solid line: token. Dashed line: stock. Exact quote times and values appear below. Historical observations. Retrieval refers to the token source. Token quote times use UTC. The fixed cohort shows its oldest member fetch.
AMD token vs AMD stock: exact source values
Date (UTC)
Token (USD)
Stock close (USD)
Token quote (UTC)
2026-08-05
487.24
482.05
2026-08-05 20:00
2026-08-06
489.75
489.28
2026-08-06 20:00
2026-08-07
483.12
483.36
2026-08-07 20:00
2026-08-10
470.08
469.56
2026-08-10 20:00
2026-08-11
469.58
474.32
2026-08-11 20:00
2026-08-12
486.62
482.93
2026-08-12 20:00
2026-08-13
483.55
483.01
2026-08-13 20:00
2026-08-14
513.09
514.39
2026-08-14 20:00
2026-08-17
505.47
506.00
2026-08-17 20:00
2026-08-18
482.45
484.39
2026-08-18 20:00
2026-08-19
466.15
466.42
2026-08-19 20:00
2026-08-20
467.56
469.46
2026-08-20 20:00
2026-08-21
473.60
473.25
2026-08-21 20:00
2026-08-24
457.55
456.75
2026-08-24 20:00
2026-08-25
479.41
479.18
2026-08-25 20:00
2026-08-26
480.52
480.93
2026-08-26 20:00
2026-08-27
474.81
476.67
2026-08-27 20:00
2026-08-28
465.95
465.58
2026-08-28 20:00
2026-08-31
470.18
470.72
2026-08-31 20:00
2026-09-01
459.91
459.61
2026-09-01 20:00
2026-09-02
459.21
457.06
2026-09-02 20:00
2026-09-03
444.08
456.16
2026-09-03 20:00
2026-09-04
476.62
477.57
2026-09-04 20:00
2026-09-08
500.35
505.74
2026-09-08 20:00
2026-09-09
519.73
521.10
2026-09-09 20:00
2026-09-10
503.99
503.60
2026-09-10 20:00
2026-09-11
514.38
516.13
2026-09-11 20:00
2026-09-14
481.66
493.41
2026-09-14 20:00
2026-09-15
504.27
504.20
2026-09-15 20:00
2026-09-16
512.46
512.50
2026-09-16 20:00
2026-09-17
545.14
545.09
2026-09-17 20:00
2026-09-18
557.88
559.82
2026-09-18 20:00
2026-09-21
615.34
615.52
2026-09-21 20:00
2026-09-22
622.08
623.77
2026-09-22 20:00
2026-09-23
613.66
614.61
2026-09-23 20:00
2026-09-24
629.06
629.26
2026-09-24 20:00
2026-09-25
630.70
630.63
2026-09-25 20:00
2026-09-28
607.85
607.87
2026-09-28 20:00
2026-09-29
607.09
607.57
2026-09-29 20:00
2026-09-30
611.52
611.76
2026-09-30 20:00
2026-10-01
616.95
615.73
2026-10-01 20:00
2026-10-02
633.03
633.91
2026-10-02 20:00
2026-10-05
630.87
631.75
2026-10-05 20:00
2026-10-06
648.78
649.42
2026-10-06 20:00
2026-10-07
645.86
645.86
2026-10-07 20:00
2026-10-08
620.92
620.68
2026-10-08 20:00
2026-10-09
607.57
608.10
2026-10-09 20:00
2026-10-12
593.94
594.24
2026-10-12 20:00
2026-10-13
605.81
605.53
2026-10-13 20:00
2026-10-14
571.93
570.82
2026-10-14 20:00
2026-10-15
562.54
562.23
2026-10-15 20:00
2026-10-16
530.05
528.75
2026-10-16 20:00
2026-10-19
538.50
538.05
2026-10-19 20:00
2026-10-20
534.45
534.74
2026-10-20 20:00
2026-10-21
553.67
552.72
2026-10-21 20:00
2026-10-22
508.65
507.93
2026-10-22 20:00
2026-10-23
515.90
516.79
2026-10-23 20:00
2026-10-26
531.61
531.28
2026-10-26 20:00
2026-10-27
560.31
560.26
2026-10-27 20:00
2026-10-28
578.45
578.44
2026-10-28 20:00
Stock history: Gloria · Retrieved Oct 29, 00:31 UTC. Token history: CoinGecko AMDx.
Quoted token and share units can have different rights, multipliers and dividend treatment. This is not an executable premium or arbitrage signal.
AMD just posted Q1 2026 revenues of $10.25 billion, a 38% jump from the prior year, with data center revenue alone hitting approximately $5.775 billion. That’s a 57% year-over-year increase in the segment that matters most right now.
AMD is going big on physical AI infrastructure. The company partnered with 5C in July 2026 to develop what it calls “gigascale AI campuses” capable of exceeding 1.5 gigawatts of capacity. These facilities are targeting neocloud customers in locations like Ohio and Memphis, utilizing AMD’s new Helios rack-scale architecture. AMD also signed a phased deployment agreement with Rackspace Technology for 30 megawatts of AMD AI compute beginning in June 2026. The company is hosting its “Advancing AI 2026” event on July 22-23 in San Francisco, where it plans to showcase its latest architecture and developer tools.
AMD expects a revenue compound annual growth rate of over 35% and a data center revenue CAGR exceeding 60% over the next three to five years. AMD shares surged approximately 114-130% year-to-date through mid-2026, dramatically outperforming Nvidia’s comparatively modest 12-18% gain over the same period.
Bitcoin miners are increasingly transitioning their operations toward AI and high-performance computing workloads. Energy infrastructure and GPU hardware originally built for proof-of-work mining can be repurposed for AI inference and training jobs. Mining operations that pivot to AI reduce the total hashrate dedicated to Bitcoin, while the hardware repurposing creates new supply for AI compute, which pressures pricing in decentralized GPU networks like Akash and Render.
AI, tech, and the markets they move—in one daily briefing.
Daily. Free. Join 34,000+ readers across crypto, finance, and policy.
Nvidia still holds a substantial market lead, largely because of its entrenched software ecosystem, particularly CUDA, which has become the default development environment for AI researchers and engineers. AMD’s Helios architecture and infrastructure partnerships signal the company is attempting to control more of the physical stack. As AMD and partners build out dedicated AI compute capacity through facilities exceeding 1.5 GW, decentralized GPU alternatives will need to compete on price, flexibility, or censorship resistance.
For traders watching the intersection of AI hardware and crypto compute markets, AMD’s next major catalyst is its Advancing AI event on July 22-23, where architecture details and new partnerships could reshape expectations for GPU supply and pricing across both centralized and decentralized networks.
Disclosure: This article was edited by Editorial Team. For more information on how we create and review content, see our Editorial Policy.