Skip to content
Advertisement
AMD stock falls 10% as AI chip sector faces broad selloff

AMD stock falls 10% as AI chip sector faces broad selloff

Broadcom's cautious earnings guidance triggered profit-taking across semiconductor stocks, dragging AMD down from its 2026 highs despite no company-specific bad news.

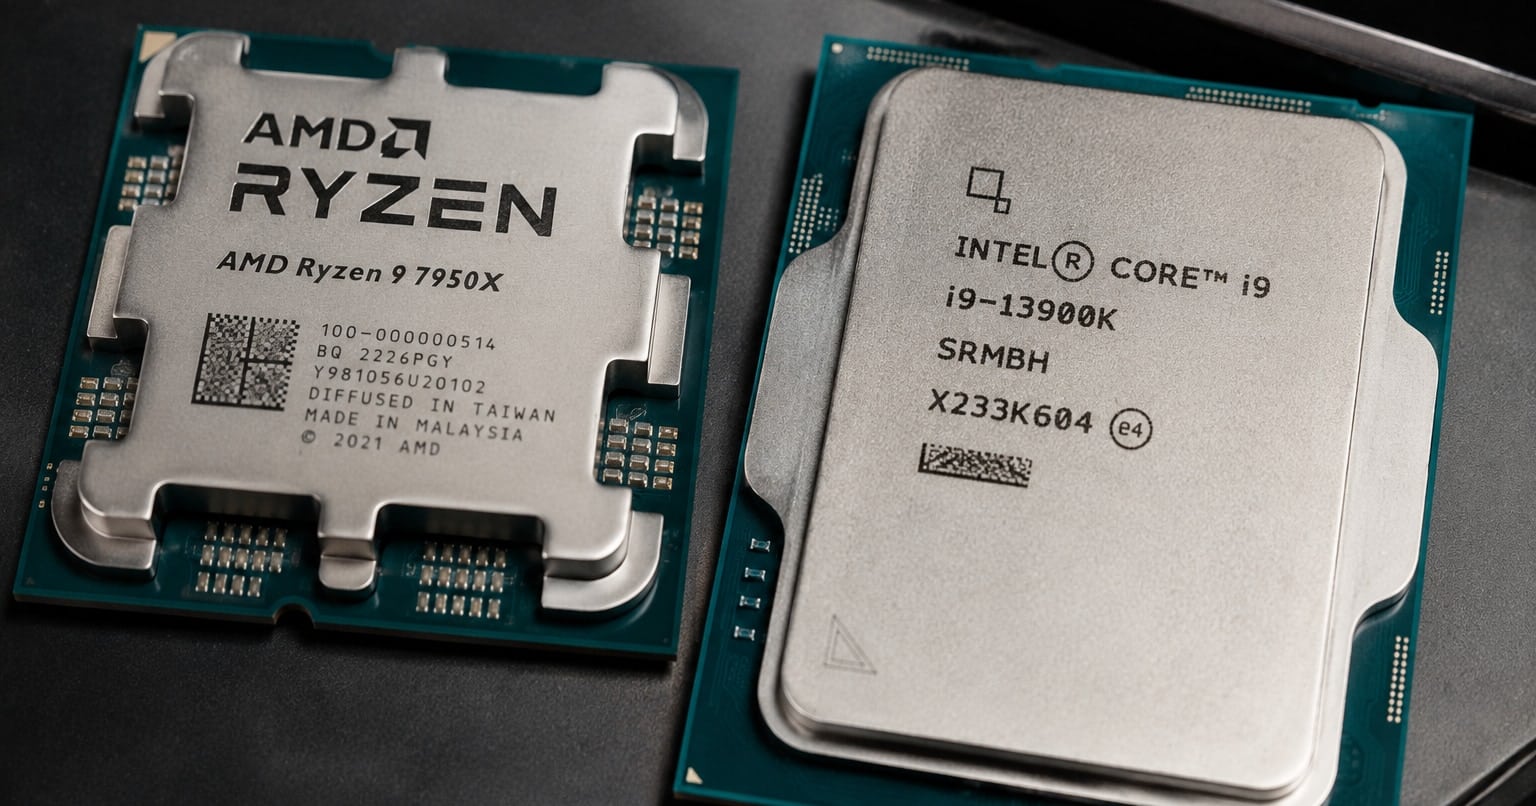
AMD shares dropped roughly 10% on June 9, wiping out billions in market value in a single session. The kicker: nothing actually went wrong at AMD.

The selloff was driven entirely by sector-wide contagion after Broadcom’s earnings report delivered a more cautious outlook on AI infrastructure spending. AMD, Intel, and other chip names all got dragged down together, with Intel falling over 8% in the same session.

What actually happened

AMD shares traded in the $446 to $475 range during the session, a steep fall from the stock’s recent peak near $542 earlier in June. For a stock that had more than doubled at various points during 2026, the correction was sharp.

The catalyst was Broadcom’s forward guidance, which tempered the market’s previously sky-high expectations for AI chip demand. Broadcom didn’t say AI spending was collapsing. It just suggested the trajectory might be less vertical than Wall Street had priced in.

Advertisement

AMD didn’t release any negative earnings revisions, lose a major contract, or face a product delay. The company was essentially collateral damage in a broader reassessment of how much the market should be paying for AI exposure in the semiconductor space.

Intel’s simultaneous 8%-plus decline reinforces this reading. When two direct competitors fall by nearly identical amounts on the same day, the cause is almost always macro or sector-level rather than company-specific.

The AI valuation reckoning

AMD’s stock had appreciated over 100% year-to-date before this correction, a run fueled by genuine revenue growth but also by speculative enthusiasm about AI infrastructure buildouts from hyperscalers like Microsoft, Google, and Amazon. When Broadcom’s report suggested that some of these spending plans might be more measured than expected, it forced a recalibration.

Analysts have been split on how to interpret the move. Some described the downturn as a potential buying opportunity, arguing that AMD’s fundamentals remain intact and the pullback represents a healthier valuation entry point. Others cautioned that the correction might signal a broader reassessment of growth assumptions across the entire semiconductor sector.

AMD’s product roadmap remains competitive. Its MI300 series accelerators continue to gain traction in data centers. The company’s revenue trajectory hasn’t deteriorated based on any publicly available information.

What this means for investors

If you bought AMD at the beginning of 2026, you’re still sitting on substantial gains even after this pullback. If you bought near the $542 peak, you’re underwater by roughly 12-17% depending on your exact entry point.

AMD is fighting for market share against Nvidia, which dominates the AI accelerator market, and against a growing roster of custom silicon from the hyperscalers themselves.

One thing to monitor closely is whether other major chipmakers revise their AI spending forecasts downward in coming earnings reports. If Broadcom’s caution turns out to be an outlier, AMD could recover quickly. If it becomes a pattern, the entire AI chip trade may need to be repriced.

Advanced Micro Devices Inc. (AMD) price

Full chart and stats

Loading chart…

Market cap
$924.7B (shares as of 2026-07-29)
P/E (trailing)
145.2 (EPS to 2026-06-27)
Annual revenue
$34.6B USD (FY ended 2025-12-27) 10-K
Annual revenue growth
+34.3% (FY ended 2025-12-27 vs FY ended 2024-12-28) 10-K
Annual net income
4,335,000,000 USD (FY ended 2025-12-27, attributable to the company) 10-K
Annual operating margin
10.7% (FY ended 2025-12-27)
Forward P/E
Unavailable: no dated forecast source

Gloria daily close for session Oct 29, 2026. Market cap and trailing P/E use this close with the SEC share total and trailing diluted earnings, each dated next to its figure. Annual revenue, revenue growth, net income and margin show their own fiscal period and link the 10-K. Current context may postdate this article.

Advanced Micro Devices Inc. and its peers

Company PriceMarket capP/E (trailing)Forward P/EAnnual revenue (USD)Annual revenue growthAnnual net income (USD)Operating margin
Advanced Micro Devices Inc. AMD · Price dated Oct 29, 2026 · tokenized AMDx $566$924.7B145.2Unavailable$34.6BFY ended 2025-12-27 · 10-K+34.3%FY ended 2025-12-27 vs 2024-12-28 · 10-K4,335,000,000FY ended 2025-12-27, attributable to the company · 10-K10.7%FY ended 2025-12-27
Micron Technology Inc. MU · Price dated Oct 29, 2026 · tokenized MUx $934$1.1T12.6Unavailable$133.2BFY ended 2026-09-03 · 10-K+256.3%FY ended 2026-09-03 vs 2025-08-28 · 10-K84,969,000,000FY ended 2026-09-03, attributable to the company · 10-K74.6%FY ended 2026-09-03
Intel Corporation INTC · Price dated Oct 29, 2026 · tokenized INTCx $92$489.4BNot meaningfulLoss, diluted EPS −2.35
to 2026-09-26 · SEC filing
Unavailable$52.9BFY ended 2025-12-27 · 10-K−0.5%FY ended 2025-12-27 vs 2024-12-28 · 10-K−267,000,000FY ended 2025-12-27, attributable to the company · 10-K−4.2%FY ended 2025-12-27
Broadcom Inc. AVGO · Price dated Oct 29, 2026 · tokenized AVGOx $345$1.6T44.0Unavailable$63.9BFY ended 2025-11-02 · 10-K+23.9%FY ended 2025-11-02 vs 2024-11-03 · 10-K23,126,000,000FY ended 2025-11-02, consolidated · 10-K39.9%FY ended 2025-11-02

Missing figures stay unavailable. Forward P/E requires a dated source. Annual revenue, revenue growth, net income and margin come from each company's own 10-K, in US dollars, and each row shows that fiscal year. Revenue growth compares the fiscal year with the prior year stated in the same 10-K. Net income is the full year amount attributable to the company, or available to common stockholders where the filing states only that, or consolidated net income. Each row names its basis. Trailing P/E reads "Not meaningful" when the dated trailing diluted EPS is a loss or zero. An operating margin appears only when the filing states both the operating income and the revenue for the same year.

Sources: SEC filings, Gloria daily closes and CoinGecko. Oldest record refresh: Oct 30, 2026, 9:06 AM EDT. Refresh is not a price or filing date. Each row shows its price date and its annual fiscal period. Peers use industry code and company size, or editorial selection. Market cap multiplies that row price by the company share total the latest SEC filing states for every share class together. Trailing P/E divides it by trailing diluted earnings from SEC filings. Rolled earnings per share are approximate because share counts can change between periods. Both appear only when the SEC data carries its date, so they are estimates at one price date, not synchronized filing valuations. Not investment advice.

Disclosure: This article was edited by Editorial Team. For more information on how we create and review content, see our Editorial Policy.

More in News

See all
Previous storyTreasuries rise as oil prices fall to lowest levels in over a month