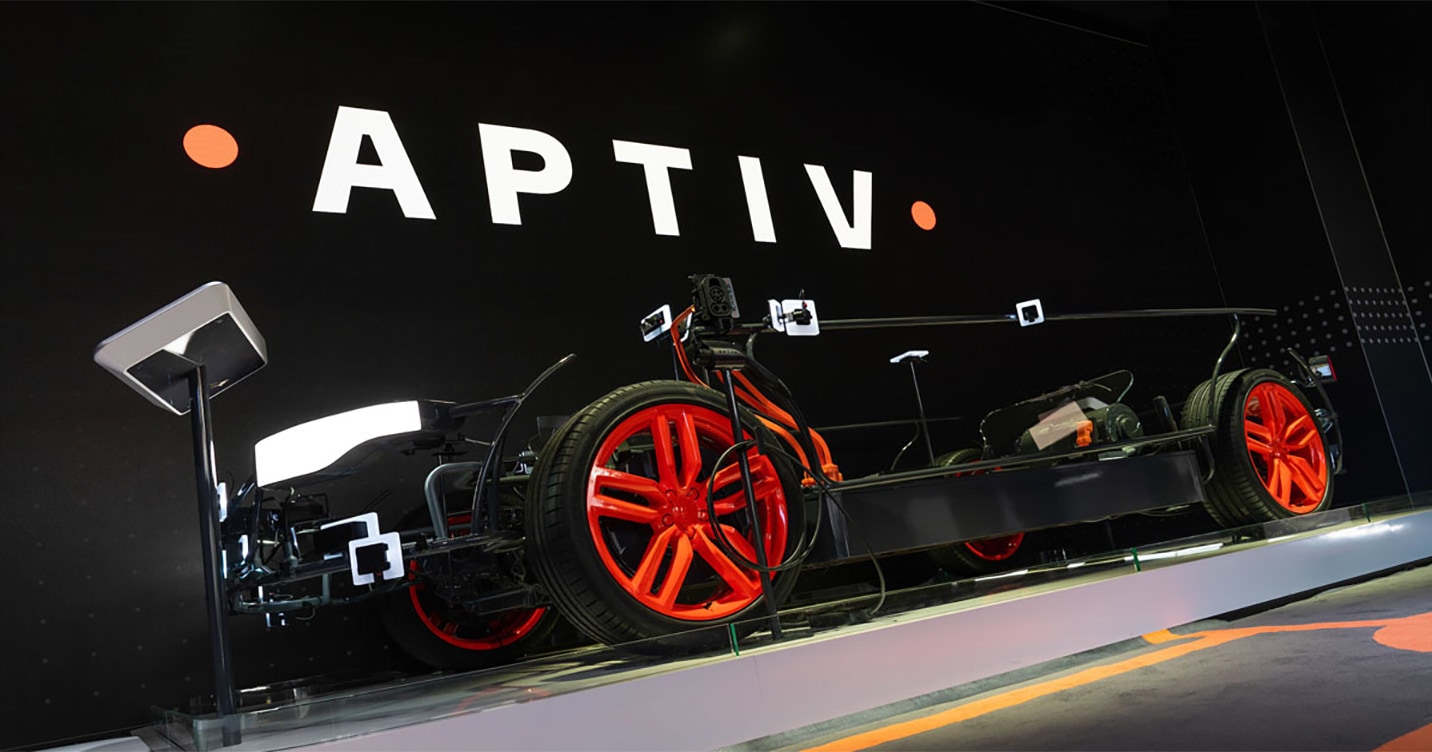
Aptiv accelerates physical AI production with Nvidia Jetson Orin Nano 2 support
Via aptiv.com
The automotive tech giant's expanded Nvidia partnership targets production-ready edge AI systems for robotics, industrial automation, and automotive sectors
+65.5% (FY ended 2026-01-25 vs FY ended 2025-01-26) 10-K
Annual net income
120,067,000,000 USD (FY ended 2026-01-25, attributable to the company) 10-K
Annual operating margin
60.4% (FY ended 2026-01-25)
Forward P/E
Unavailable: no dated forecast source
Gloria daily close for session Oct 29, 2026. Market cap and trailing P/E use this close with the SEC share total and trailing diluted earnings, each dated next to its figure. Annual revenue, revenue growth, net income and margin show their own fiscal period and link the 10-K. Current context may postdate this article.
4,335,000,000FY ended 2025-12-27, attributable to the company · 10-K
10.7%FY ended 2025-12-27
Missing figures stay unavailable. Forward P/E requires a dated source. Annual revenue, revenue growth, net income and margin come from each company's own 10-K, in US dollars, and each row shows that fiscal year. Revenue growth compares the fiscal year with the prior year stated in the same 10-K. Net income is the full year amount attributable to the company, or available to common stockholders where the filing states only that, or consolidated net income. Each row names its basis. Trailing P/E reads "Not meaningful" when the dated trailing diluted EPS is a loss or zero. An operating margin appears only when the filing states both the operating income and the revenue for the same year.
Sources: SEC filings, Gloria daily closes and CoinGecko. Oldest record refresh: Oct 29, 2026, 1:52 PM EDT. Refresh is not a price or filing date. Each row shows its price date and its annual fiscal period. Peers use industry code and company size, or editorial selection. Market cap multiplies that row price by the company share total the latest SEC filing states for every share class together. Trailing P/E divides it by trailing diluted earnings from SEC filings. Rolled earnings per share are approximate because share counts can change between periods. Both appear only when the SEC data carries its date, so they are estimates at one price date, not synchronized filing valuations. Not investment advice.
Token vs underlying stock
Current comparison for NVDA. Historical observations may postdate this article.
Split-adjusted regular-session stock closes from the existing Gloria shared history, paired only with an observed token price within 45 minutes of 16:00 New York time. Up to 60 matched sessions. No interpolation or missing-date fill. Weekends and known early closes are omitted. Token units are not adjusted for issuer multipliers or dividend treatment. This compares quoted prices, not fair value, executable premiums or arbitrage returns. Solid line: token. Dashed line: stock. Exact quote times and values appear below. Historical observations. Retrieval refers to the token source. Token quote times use UTC. The fixed cohort shows its oldest member fetch.
Nvidia token vs Nvidia stock: exact source values
Date (UTC)
Token (USD)
Stock close (USD)
Token quote (UTC)
2026-08-06
219.15
218.99
2026-08-06 20:00
2026-08-07
223.93
223.96
2026-08-07 20:00
2026-08-10
217.66
217.55
2026-08-10 20:00
2026-08-11
217.53
217.50
2026-08-11 20:00
2026-08-12
224.12
224.09
2026-08-12 20:00
2026-08-13
225.42
225.30
2026-08-13 20:00
2026-08-14
225.34
225.16
2026-08-14 20:00
2026-08-17
225.13
225.01
2026-08-17 20:00
2026-08-18
219.70
219.74
2026-08-18 20:00
2026-08-19
217.76
217.56
2026-08-19 20:00
2026-08-20
216.79
216.85
2026-08-20 20:00
2026-08-21
214.85
214.72
2026-08-21 20:00
2026-08-24
208.75
208.48
2026-08-24 20:00
2026-08-25
213.16
213.05
2026-08-25 20:00
2026-08-26
210.06
209.66
2026-08-26 20:00
2026-08-27
227.96
227.98
2026-08-27 20:00
2026-08-28
217.74
217.55
2026-08-28 20:00
2026-08-31
220.91
220.78
2026-08-31 20:00
2026-09-01
217.58
217.44
2026-09-01 20:00
2026-09-02
224.46
224.41
2026-09-02 20:00
2026-09-03
228.90
228.45
2026-09-03 20:00
2026-09-04
230.35
230.36
2026-09-04 20:00
2026-09-08
225.69
225.73
2026-09-08 20:00
2026-09-09
223.89
223.67
2026-09-09 20:00
2026-09-10
218.70
218.36
2026-09-10 20:00
2026-09-11
218.92
218.29
2026-09-11 20:00
2026-09-14
211.47
210.96
2026-09-14 20:00
2026-09-15
212.34
212.17
2026-09-15 20:00
2026-09-16
214.25
213.90
2026-09-16 20:00
2026-09-17
219.68
219.34
2026-09-17 20:00
2026-09-18
222.24
222.27
2026-09-18 20:00
2026-09-21
227.69
227.38
2026-09-21 20:00
2026-09-22
229.20
228.87
2026-09-22 20:00
2026-09-23
225.44
225.51
2026-09-23 20:00
2026-09-24
224.87
224.58
2026-09-24 20:00
2026-09-25
225.29
225.07
2026-09-25 20:00
2026-09-28
228.97
228.86
2026-09-28 20:00
2026-09-29
227.95
227.21
2026-09-29 20:00
2026-09-30
229.85
228.38
2026-09-30 20:00
2026-10-01
231.18
230.86
2026-10-01 20:00
2026-10-02
234.38
233.95
2026-10-02 20:00
2026-10-05
239.30
238.90
2026-10-05 20:00
2026-10-06
239.71
239.24
2026-10-06 20:00
2026-10-07
237.80
237.47
2026-10-07 20:00
2026-10-08
230.81
230.48
2026-10-08 20:00
2026-10-09
229.70
229.28
2026-10-09 20:00
2026-10-12
226.87
226.32
2026-10-12 20:00
2026-10-13
228.73
228.52
2026-10-13 20:00
2026-10-14
221.56
221.30
2026-10-14 20:00
2026-10-15
217.48
217.23
2026-10-15 20:00
2026-10-16
214.56
214.13
2026-10-16 20:00
2026-10-19
217.41
217.09
2026-10-19 20:00
2026-10-20
216.69
216.47
2026-10-20 20:00
2026-10-21
222.20
221.97
2026-10-21 20:00
2026-10-22
212.42
212.21
2026-10-22 20:00
2026-10-23
211.27
210.96
2026-10-23 20:00
2026-10-26
216.15
216.00
2026-10-26 20:00
2026-10-27
218.06
217.94
2026-10-27 20:00
2026-10-28
215.40
215.38
2026-10-28 20:00
2026-10-29
213.57
213.66
2026-10-29 20:00
Stock history: Gloria · Retrieved Oct 30, 00:32 UTC. Token history: CoinGecko NVDAx.
Quoted token and share units can have different rights, multipliers and dividend treatment. This is not an executable premium or arbitrage signal.
Aptiv PLC just deepened its relationship with Nvidia, and the stock market noticed. The automotive and industrial technology company announced an expanded collaboration to deliver production-ready edge AI platforms built on Nvidia’s Jetson ecosystem, and shares responded with a 6.2% intraday pop.
What Aptiv and Nvidia are actually building
The collaboration targets edge AI platforms, systems that process data locally rather than shipping everything to the cloud. At the hardware level, the partnership aligns with Nvidia’s Jetson Orin Nano 2 robotics computer. This updated variant delivers up to twice the inference performance of its predecessor while cutting power consumption by roughly 40% at comparable loads. The Orin Nano series can push up to 67 TOPS (tera operations per second). That’s enough horsepower for real-time object detection, path planning, and sensor fusion, the core building blocks of physical AI in robotics and automotive applications.
Aptiv’s contribution sits on the software and compliance side. The company is providing Cyber Resilience Act-ready Yocto platforms and enterprise Linux support, which translates to pre-configured operating systems that meet European cybersecurity regulations out of the box.
Why the production gap matters
Aptiv offers comprehensive software support, security features, lifecycle management, and commercial deployment tools designed to reduce fragmentation across deployments. In industries like automotive, where a single platform might need to function reliably for 15 years, managing software updates and security vulnerabilities becomes a significant operational challenge.
AI, tech, and the markets they move—in one daily briefing.
Daily. Free. Join 34,000+ readers across crypto, finance, and policy.
The sectors in play here are broad: robotics, industrial automation, and automotive.
Market context
The 6.2% share price jump followed the June 1 announcement. Some market observers have speculated about broader momentum that could push gains as high as 25%, though that projection depends on commercial uptake. Notably, Aptiv did not explicitly endorse the new Orin Nano 2 variant in its own communications, though the alignment of its production support with Nvidia’s advancing hardware signals collaborative intent. Design wins in automotive and industrial sectors typically take 12 to 24 months to translate into meaningful revenue.
Disclosure: This article was edited by Editorial Team. For more information on how we create and review content, see our Editorial Policy.