Broadcom reports record Q2 revenue of $22B, driven by AI growth
The chipmaker's AI semiconductor revenue surged 143% year-over-year, and Q3 guidance suggests the trajectory is only steepening.
Broadcom just posted the kind of quarter that makes other chipmakers sweat. The company reported fiscal Q2 2026 revenue of $22.2 billion, a 48% jump from the same period last year, with AI semiconductors doing most of the heavy lifting.
AI chip revenue alone hit $10.8 billion, up 143% year-over-year. To put that in perspective, Broadcom’s entire AI semiconductor business last quarter pulled in $8.4 billion. It grew by nearly $2.4 billion in a single quarter.
The numbers behind the record
Adjusted EBITDA came in at $15.2 billion, representing 69% of total revenue.
Free cash flow was $10.3 billion.
CEO Hock Tan pointed to what he described as accelerating AI momentum, noting that the company has now strung together 13 consecutive quarters of growth in its AI segment.
The growth is being fueled by demand for custom AI accelerators and networking solutions built for hyperscale customers.
The news moving money, markets, and the world—before your day starts.
Daily. Free. Join 34,000+ readers across crypto, finance, and policy.
Q3 guidance raises the stakes
Broadcom is guiding for approximately $29.4 billion in total consolidated revenue for Q3 2026. That would represent an 84% increase year-over-year.
Within that, the company anticipates AI semiconductor revenue of $16.0 billion. That’s a roughly 48% sequential jump from the $10.8 billion it just reported.
The longer-term target is even more ambitious. Broadcom is aiming for more than $100 billion in annual AI chip revenue by 2027.
Why the stock dipped anyway
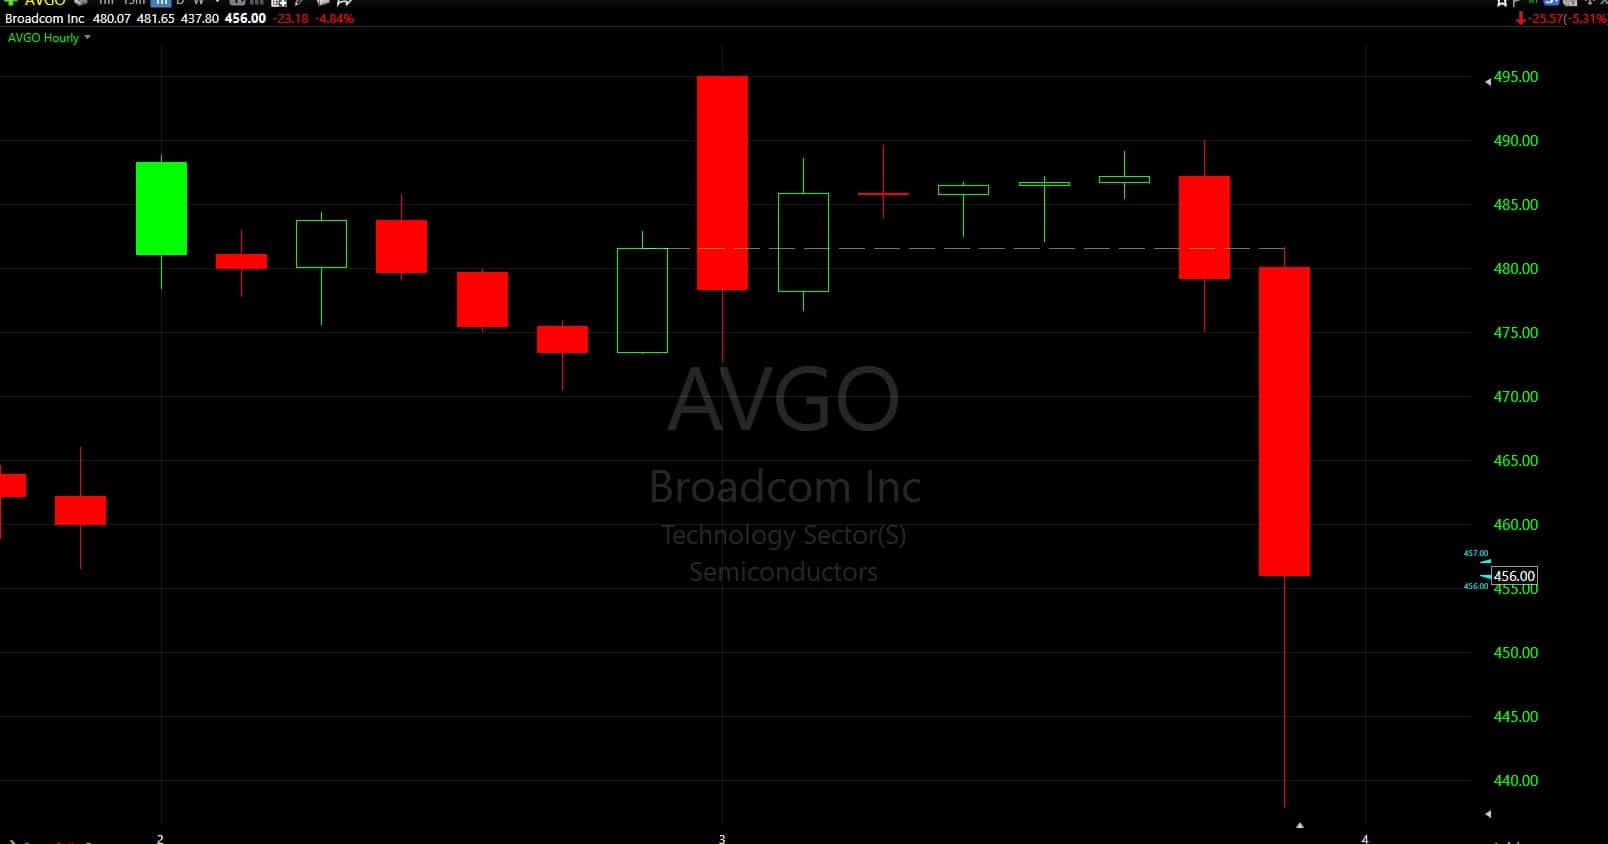
Despite the record quarter and eye-popping guidance, Broadcom shares declined in after-hours trading following the announcement.
Market analysts have attributed the post-earnings dip to the specifics of Broadcom’s guidance. The results slightly exceeded consensus estimates, but “slightly” is the operative word.
That said, the custom silicon market where Broadcom operates is somewhat insulated from the GPU arms race. Broadcom, along with Marvell Technology, has carved out a strong position in this niche.
Broadcom Inc. and its peers
| Company | Price | Market cap | P/E (trailing) | Forward P/E | Annual revenue (USD) | Annual revenue growth | Annual net income (USD) | Operating margin |
|---|---|---|---|---|---|---|---|---|
|
|
$364 | $1.7T | 46.5 | Unavailable | $63.9BFY ended 2025-11-02 · 10-K | +23.9%FY ended 2025-11-02 vs 2024-11-03 · 10-K | 23,126,000,000FY ended 2025-11-02, consolidated · 10-K | 39.9%FY ended 2025-11-02 |
|
|
$585 | $959.9B | 127.0 | Unavailable | $34.6BFY ended 2025-12-27 · 10-K | +34.3%FY ended 2025-12-27 vs 2024-12-28 · 10-K | 4,335,000,000FY ended 2025-12-27, attributable to the company · 10-K | 10.7%FY ended 2025-12-27 |
|
|
$798 | $903.4B | 10.7 | Unavailable | $133.2BFY ended 2026-09-03 · 10-K | +256.3%FY ended 2026-09-03 vs 2025-08-28 · 10-K | 84,969,000,000FY ended 2026-09-03, attributable to the company · 10-K | 74.6%FY ended 2026-09-03 |
|
|
$166 | $4.0T | 21.0 | Unavailable | $215.9BFY ended 2026-01-25 · 10-K | +65.5%FY ended 2026-01-25 vs 2025-01-26 · 10-K | 120,067,000,000FY ended 2026-01-25, attributable to the company · 10-K | 60.4%FY ended 2026-01-25 |
Missing figures stay unavailable. Forward P/E requires a dated source. Annual revenue, revenue growth, net income and margin come from each company's own 10-K, in US dollars, and each row shows that fiscal year. Revenue growth compares the fiscal year with the prior year stated in the same 10-K. Net income is the full year amount attributable to the company, or available to common stockholders where the filing states only that, or consolidated net income. Each row names its basis. Trailing P/E reads "Not meaningful" when the dated trailing diluted EPS is a loss or zero. An operating margin appears only when the filing states both the operating income and the revenue for the same year.
Sources: SEC filings, Gloria daily closes and CoinGecko. Oldest record refresh: Nov 12, 2026, 6:06 PM EST. Refresh is not a price or filing date. Each row shows its price date and its annual fiscal period. Peers use industry code and company size, or editorial selection. Market cap multiplies that row price by the company share total the latest SEC filing states for every share class together. Trailing P/E divides it by trailing diluted earnings from SEC filings. Rolled earnings per share are approximate because share counts can change between periods. Both appear only when the SEC data carries its date, so they are estimates at one price date, not synchronized filing valuations. Not investment advice.
Disclosure: This article was edited by Editorial Team. For more information on how we create and review content, see our Editorial Policy.


