Skip to content
Advertisement
Google launches Gemini 3.5 Flash, its most powerful AI model yet

Google launches Gemini 3.5 Flash, its most powerful AI model yet

Google's latest AI model can autonomously build software and execute complex tasks, raising questions about the future of decentralized AI networks in crypto.

Alphabet Inc. (GOOGL) price

Full chart and stats

Loading chart…

Market cap
$3.9T (shares as of 2026-06-30)
P/E (trailing)
16.1 (EPS to 2026-06-30)
Annual revenue
$402.8B USD (FY ended 2025-12-31) 10-K
Annual revenue growth
+15.1% (FY ended 2025-12-31 vs FY ended 2024-12-31) 10-K
Annual net income
132,170,000,000 USD (FY ended 2025-12-31, attributable to the company) 10-K
Annual operating margin
32.0% (FY ended 2025-12-31)
Forward P/E
Unavailable: no dated forecast source

Gloria daily close for session Oct 27, 2026. Market cap and trailing P/E use this close with the SEC share total and trailing diluted earnings, each dated next to its figure. Annual revenue, revenue growth, net income and margin show their own fiscal period and link the 10-K. Current context may postdate this article.

Alphabet Inc. and its peers

Company PriceMarket capP/E (trailing)Forward P/EAnnual revenue (USD)Annual revenue growthAnnual net income (USD)Operating margin
Alphabet Inc. GOOGL · Price dated Oct 27, 2026 · tokenized GOOGLx $321$3.9T16.1Unavailable$402.8BFY ended 2025-12-31 · 10-K+15.1%FY ended 2025-12-31 vs 2024-12-31 · 10-K132,170,000,000FY ended 2025-12-31, attributable to the company · 10-K32.0%FY ended 2025-12-31
Alphabet Inc. (Class C) GOOG · Price dated Oct 27, 2026 $317$3.9T15.9Unavailable$402.8BFY ended 2025-12-31 · 10-K+15.1%FY ended 2025-12-31 vs 2024-12-31 · 10-K132,170,000,000FY ended 2025-12-31, attributable to the company · 10-K32.0%FY ended 2025-12-31
Meta Platforms Inc. META · Price dated Oct 27, 2026 · tokenized METAx $620$1.6T21.2Unavailable$201.0BFY ended 2025-12-31 · 10-K+22.2%FY ended 2025-12-31 vs 2024-12-31 · 10-K60,458,000,000FY ended 2025-12-31, attributable to the company · 10-K41.4%FY ended 2025-12-31
AppLovin Corporation APP · Price dated Oct 27, 2026 · tokenized APPx $263$88.1B20.2Unavailable$5.5BFY ended 2025-12-31 · 10-K+70.0%FY ended 2025-12-31 vs 2024-12-31 · 10-K3,333,751,000FY ended 2025-12-31, attributable to the company · 10-K75.8%FY ended 2025-12-31

Missing figures stay unavailable. Forward P/E requires a dated source. Annual revenue, revenue growth, net income and margin come from each company's own 10-K, in US dollars, and each row shows that fiscal year. Revenue growth compares the fiscal year with the prior year stated in the same 10-K. Net income is the full year amount attributable to the company, or available to common stockholders where the filing states only that, or consolidated net income. Each row names its basis. Trailing P/E reads "Not meaningful" when the dated trailing diluted EPS is a loss or zero. An operating margin appears only when the filing states both the operating income and the revenue for the same year.

Sources: SEC filings, Gloria daily closes and CoinGecko. Oldest record refresh: Oct 27, 2026, 8:48 PM EDT. Refresh is not a price or filing date. Each row shows its price date and its annual fiscal period. Peers use industry code and company size, or editorial selection. Market cap multiplies that row price by the company share total the latest SEC filing states for every share class together. Trailing P/E divides it by trailing diluted earnings from SEC filings. Rolled earnings per share are approximate because share counts can change between periods. Both appear only when the SEC data carries its date, so they are estimates at one price date, not synchronized filing valuations. Not investment advice.

Token vs underlying stock

Current comparison for GOOGL. Historical observations may postdate this article.

GOOGLx token unit vs GOOGL share · USD

$321.43Oct 27 UTC

-15.0% over displayed period

● GOOGLx token┄ GOOGL stock: $320.58

Aug 4, 2026: token $378.19 at 20:00 UTC; stock close $377.65 Aug 5, 2026: token $363.03 at 20:00 UTC; stock close $362.43 Aug 6, 2026: token $358.14 at 20:00 UTC; stock close $357.75 Aug 7, 2026: token $355.20 at 20:00 UTC; stock close $354.30 Aug 10, 2026: token $357.76 at 20:00 UTC; stock close $357.52 Aug 11, 2026: token $344.26 at 20:00 UTC; stock close $343.80 Aug 12, 2026: token $344.44 at 20:00 UTC; stock close $343.54 Aug 13, 2026: token $347.06 at 20:00 UTC; stock close $346.36 Aug 14, 2026: token $346.47 at 20:00 UTC; stock close $345.90 Aug 17, 2026: token $344.71 at 20:00 UTC; stock close $344.00 Aug 18, 2026: token $344.71 at 20:00 UTC; stock close $344.20 Aug 19, 2026: token $345.42 at 20:00 UTC; stock close $344.72 Aug 20, 2026: token $341.21 at 20:00 UTC; stock close $340.67 Aug 21, 2026: token $345.60 at 20:00 UTC; stock close $344.82 Aug 24, 2026: token $348.94 at 20:00 UTC; stock close $348.06 Aug 25, 2026: token $347.59 at 20:00 UTC; stock close $346.96 Aug 26, 2026: token $342.69 at 20:00 UTC; stock close $342.00 Aug 27, 2026: token $341.18 at 20:00 UTC; stock close $340.65 Aug 28, 2026: token $347.10 at 20:00 UTC; stock close $346.59 Aug 31, 2026: token $339.89 at 20:00 UTC; stock close $339.35 Sep 1, 2026: token $335.42 at 20:00 UTC; stock close $335.02 Sep 2, 2026: token $337.78 at 20:00 UTC; stock close $337.12 Sep 3, 2026: token $342.96 at 20:00 UTC; stock close $342.48 Sep 4, 2026: token $339.38 at 20:00 UTC; stock close $338.46 Sep 8, 2026: token $338.99 at 20:00 UTC; stock close $338.36 Sep 9, 2026: token $331.31 at 20:00 UTC; stock close $330.65 Sep 10, 2026: token $333.00 at 20:00 UTC; stock close $332.60 Sep 11, 2026: token $339.44 at 20:00 UTC; stock close $338.50 Sep 14, 2026: token $350.02 at 20:00 UTC; stock close $349.39 Sep 15, 2026: token $345.54 at 20:00 UTC; stock close $344.98 Sep 16, 2026: token $343.72 at 20:00 UTC; stock close $342.87 Sep 17, 2026: token $348.19 at 20:00 UTC; stock close $347.33 Sep 18, 2026: token $349.96 at 20:00 UTC; stock close $349.54 Sep 21, 2026: token $355.68 at 20:00 UTC; stock close $354.97 Sep 22, 2026: token $351.84 at 20:00 UTC; stock close $351.16 Sep 23, 2026: token $338.83 at 20:00 UTC; stock close $337.83 Sep 24, 2026: token $343.15 at 20:00 UTC; stock close $342.36 Sep 25, 2026: token $344.56 at 20:00 UTC; stock close $343.92 Sep 28, 2026: token $343.44 at 20:00 UTC; stock close $342.75 Sep 29, 2026: token $341.65 at 20:00 UTC; stock close $340.92 Sep 30, 2026: token $344.99 at 20:00 UTC; stock close $344.08 Oct 1, 2026: token $339.14 at 20:00 UTC; stock close $338.24 Oct 2, 2026: token $344.17 at 20:00 UTC; stock close $343.50 Oct 5, 2026: token $347.05 at 20:00 UTC; stock close $346.47 Oct 6, 2026: token $348.53 at 20:00 UTC; stock close $347.68 Oct 7, 2026: token $351.27 at 20:00 UTC; stock close $350.50 Oct 8, 2026: token $348.51 at 20:00 UTC; stock close $348.29 Oct 9, 2026: token $352.71 at 20:00 UTC; stock close $351.66 Oct 12, 2026: token $353.57 at 20:00 UTC; stock close $352.72 Oct 13, 2026: token $354.45 at 20:00 UTC; stock close $353.78 Oct 14, 2026: token $347.97 at 20:00 UTC; stock close $347.64 Oct 15, 2026: token $350.19 at 20:00 UTC; stock close $349.22 Oct 16, 2026: token $341.50 at 20:00 UTC; stock close $340.59 Oct 19, 2026: token $345.25 at 20:00 UTC; stock close $344.18 Oct 20, 2026: token $340.61 at 20:00 UTC; stock close $340.28 Oct 21, 2026: token $335.85 at 20:00 UTC; stock close $334.76 Oct 22, 2026: token $324.33 at 20:00 UTC; stock close $324.22 Oct 23, 2026: token $321.30 at 20:00 UTC; stock close $320.21 Oct 26, 2026: token $317.69 at 20:00 UTC; stock close $316.80 Oct 27, 2026: token $321.43 at 20:00 UTC; stock close $320.58
Aug 4$316.80 to $378.19Oct 27

Source: CoinGecko + Gloria · Retrieved Oct 28, 06:41 UTC

Methodology and data

Split-adjusted regular-session stock closes from the existing Gloria shared history, paired only with an observed token price within 45 minutes of 16:00 New York time. Up to 60 matched sessions. No interpolation or missing-date fill. Weekends and known early closes are omitted. Token units are not adjusted for issuer multipliers or dividend treatment. This compares quoted prices, not fair value, executable premiums or arbitrage returns. Solid line: token. Dashed line: stock. Exact quote times and values appear below. Historical observations. Retrieval refers to the token source. Token quote times use UTC. The fixed cohort shows its oldest member fetch.

Alphabet token vs Alphabet stock: exact source values
Date (UTC)Token (USD)Stock close (USD)Token quote (UTC)
2026-08-04378.19377.652026-08-04 20:00
2026-08-05363.03362.432026-08-05 20:00
2026-08-06358.14357.752026-08-06 20:00
2026-08-07355.20354.302026-08-07 20:00
2026-08-10357.76357.522026-08-10 20:00
2026-08-11344.26343.802026-08-11 20:00
2026-08-12344.44343.542026-08-12 20:00
2026-08-13347.06346.362026-08-13 20:00
2026-08-14346.47345.902026-08-14 20:00
2026-08-17344.71344.002026-08-17 20:00
2026-08-18344.71344.202026-08-18 20:00
2026-08-19345.42344.722026-08-19 20:00
2026-08-20341.21340.672026-08-20 20:00
2026-08-21345.60344.822026-08-21 20:00
2026-08-24348.94348.062026-08-24 20:00
2026-08-25347.59346.962026-08-25 20:00
2026-08-26342.69342.002026-08-26 20:00
2026-08-27341.18340.652026-08-27 20:00
2026-08-28347.10346.592026-08-28 20:00
2026-08-31339.89339.352026-08-31 20:00
2026-09-01335.42335.022026-09-01 20:00
2026-09-02337.78337.122026-09-02 20:00
2026-09-03342.96342.482026-09-03 20:00
2026-09-04339.38338.462026-09-04 20:00
2026-09-08338.99338.362026-09-08 20:00
2026-09-09331.31330.652026-09-09 20:00
2026-09-10333.00332.602026-09-10 20:00
2026-09-11339.44338.502026-09-11 20:00
2026-09-14350.02349.392026-09-14 20:00
2026-09-15345.54344.982026-09-15 20:00
2026-09-16343.72342.872026-09-16 20:00
2026-09-17348.19347.332026-09-17 20:00
2026-09-18349.96349.542026-09-18 20:00
2026-09-21355.68354.972026-09-21 20:00
2026-09-22351.84351.162026-09-22 20:00
2026-09-23338.83337.832026-09-23 20:00
2026-09-24343.15342.362026-09-24 20:00
2026-09-25344.56343.922026-09-25 20:00
2026-09-28343.44342.752026-09-28 20:00
2026-09-29341.65340.922026-09-29 20:00
2026-09-30344.99344.082026-09-30 20:00
2026-10-01339.14338.242026-10-01 20:00
2026-10-02344.17343.502026-10-02 20:00
2026-10-05347.05346.472026-10-05 20:00
2026-10-06348.53347.682026-10-06 20:00
2026-10-07351.27350.502026-10-07 20:00
2026-10-08348.51348.292026-10-08 20:00
2026-10-09352.71351.662026-10-09 20:00
2026-10-12353.57352.722026-10-12 20:00
2026-10-13354.45353.782026-10-13 20:00
2026-10-14347.97347.642026-10-14 20:00
2026-10-15350.19349.222026-10-15 20:00
2026-10-16341.50340.592026-10-16 20:00
2026-10-19345.25344.182026-10-19 20:00
2026-10-20340.61340.282026-10-20 20:00
2026-10-21335.85334.762026-10-21 20:00
2026-10-22324.33324.222026-10-22 20:00
2026-10-23321.30320.212026-10-23 20:00
2026-10-26317.69316.802026-10-26 20:00
2026-10-27321.43320.582026-10-27 20:00

Stock history: Gloria · Retrieved Oct 28, 00:31 UTC. Token history: CoinGecko GOOGLx.

Quoted token and share units can have different rights, multipliers and dividend treatment. This is not an executable premium or arbitrage signal.

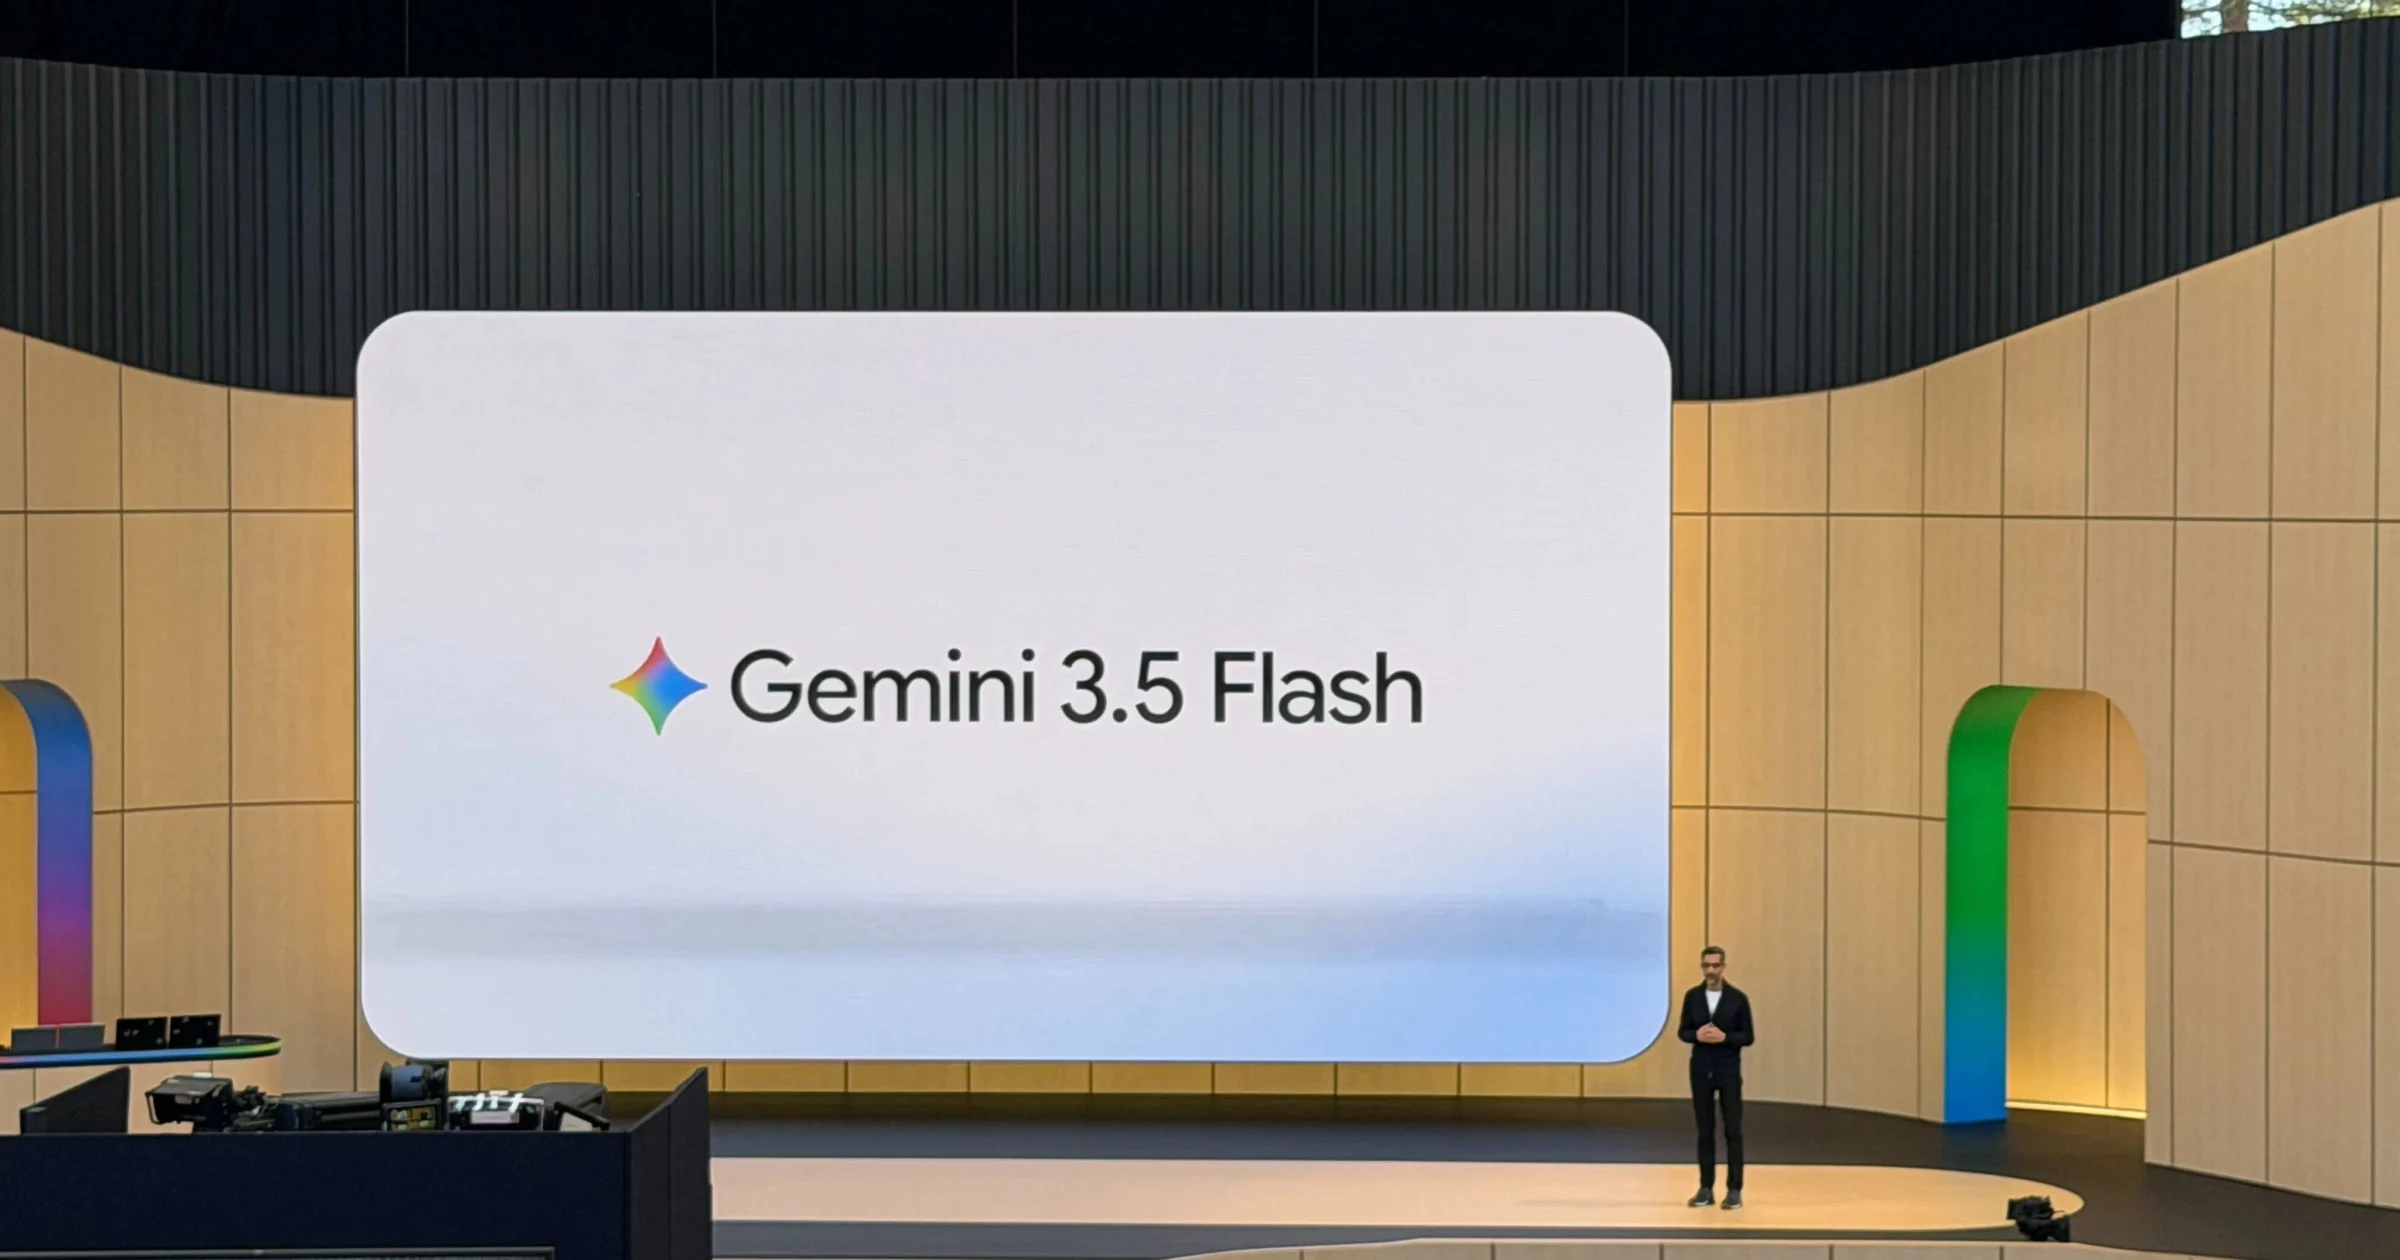
Google just unveiled Gemini 3.5 Flash at its annual developer conference, calling it the company’s most powerful coding and agentic AI model to date. The model can autonomously execute complex tasks and build software from scratch.

For the crypto industry, the implications are pointed. Decentralized AI projects have spent the last two years pitching themselves as the open, permissionless alternative to Big Tech’s walled gardens.

What Gemini 3.5 Flash actually does

The model is optimized for three things: coding, reasoning, and what Google calls “agentic workflows.” In English: it can take a high-level instruction, break it into steps, write the code, call external APIs, and execute the whole thing without a human babysitting each stage.

Advertisement

It supports multimodal inputs, meaning it can process text, images, and other data types in a single conversation. The context window stretches to 1 million tokens, which is roughly the equivalent of feeding it an entire codebase or a few hundred pages of documentation and asking it to work with all of it at once.

On the performance side, Google claims Gemini 3.5 Flash runs 3x faster than Gemini 2.5 Pro. API pricing comes in at $0.50 per 1 million input tokens and $3 per 1 million output tokens. That pricing structure matters because it puts sophisticated AI capabilities within reach of small development teams and individual builders, not just well-funded enterprises.

The model is rolling out across Google’s ecosystem, including the Gemini App and AI Mode in Search, with a clear focus on developers and enterprise customers.

Why crypto should be paying attention

Gemini 3.5 Flash’s agentic capabilities are directly relevant to crypto use cases. Autonomous agents that can write code, interact with APIs, and execute multi-step workflows are exactly the kind of tools that on-chain trading systems, DAO governance frameworks, and DeFi protocols have been trying to build.

At $0.50 per million input tokens, Google is essentially commoditizing the inference layer. Decentralized AI networks that charge for compute on a per-token or per-task basis now have to justify their premium against Google’s pricing and infrastructure.

The broader AI arms race

Google’s announcement lands in the middle of an intensifying competition among tech giants. OpenAI, Anthropic, Meta, and now Google are all shipping increasingly capable models at lower price points and faster speeds.

The projects most likely to weather this pressure are the ones solving problems that centralized providers genuinely cannot or will not address. Verifiable inference, where you can cryptographically prove that a model produced a specific output, is one example. Privacy-preserving computation is another. These are areas where blockchain architecture provides structural advantages, not just ideological ones.

Disclosure: This article was edited by Editorial Team. For more information on how we create and review content, see our Editorial Policy.