+17.8% (FY ended 2026-06-30 vs FY ended 2025-06-30) 10-K
Annual net income
133,749,000,000 USD (FY ended 2026-06-30, attributable to the company) 10-K
Annual operating margin
46.8% (FY ended 2026-06-30)
Forward P/E
Unavailable: no dated forecast source
Gloria daily close for session Oct 29, 2026. Market cap and trailing P/E use this close with the SEC share total and trailing diluted earnings, each dated next to its figure. Annual revenue, revenue growth, net income and margin show their own fiscal period and link the 10-K. Current context may postdate this article.
−162,502,000FY ended 2026-01-31, attributable to the company · 10-K
−6.1%FY ended 2026-01-31
Missing figures stay unavailable. Forward P/E requires a dated source. Annual revenue, revenue growth, net income and margin come from each company's own 10-K, in US dollars, and each row shows that fiscal year. Revenue growth compares the fiscal year with the prior year stated in the same 10-K. Net income is the full year amount attributable to the company, or available to common stockholders where the filing states only that, or consolidated net income. Each row names its basis. Trailing P/E reads "Not meaningful" when the dated trailing diluted EPS is a loss or zero. An operating margin appears only when the filing states both the operating income and the revenue for the same year.
Sources: SEC filings, Gloria daily closes and CoinGecko. Oldest record refresh: Oct 29, 2026, 1:46 PM EDT. Refresh is not a price or filing date. Each row shows its price date and its annual fiscal period. Peers use industry code and company size, or editorial selection. Market cap multiplies that row price by the company share total the latest SEC filing states for every share class together. Trailing P/E divides it by trailing diluted earnings from SEC filings. Rolled earnings per share are approximate because share counts can change between periods. Both appear only when the SEC data carries its date, so they are estimates at one price date, not synchronized filing valuations. Not investment advice.
Token vs underlying stock
Current comparison for MSFT. Historical observations may postdate this article.
Split-adjusted regular-session stock closes from the existing Gloria shared history, paired only with an observed token price within 45 minutes of 16:00 New York time. Up to 60 matched sessions. No interpolation or missing-date fill. Weekends and known early closes are omitted. Token units are not adjusted for issuer multipliers or dividend treatment. This compares quoted prices, not fair value, executable premiums or arbitrage returns. Solid line: token. Dashed line: stock. Exact quote times and values appear below. Historical observations. Retrieval refers to the token source. Token quote times use UTC. The fixed cohort shows its oldest member fetch.
Microsoft token vs Microsoft stock: exact source values
Date (UTC)
Token (USD)
Stock close (USD)
Token quote (UTC)
2026-08-06
498.48
499.86
2026-08-06 20:00
2026-08-07
501.35
499.99
2026-08-07 20:00
2026-08-10
507.81
506.06
2026-08-10 20:00
2026-08-11
503.83
503.81
2026-08-11 20:00
2026-08-12
493.50
492.43
2026-08-12 20:00
2026-08-13
494.66
496.88
2026-08-13 20:00
2026-08-14
496.96
495.40
2026-08-14 20:00
2026-08-17
481.91
480.35
2026-08-17 20:00
2026-08-18
482.93
481.63
2026-08-18 20:00
2026-08-19
484.48
484.31
2026-08-19 20:00
2026-08-20
482.95
481.15
2026-08-20 20:00
2026-08-21
485.28
483.24
2026-08-21 20:00
2026-08-24
489.80
487.31
2026-08-24 20:00
2026-08-25
491.36
491.71
2026-08-25 20:00
2026-08-26
498.86
496.37
2026-08-26 20:00
2026-08-27
506.15
505.06
2026-08-27 20:00
2026-08-28
514.87
513.53
2026-08-28 20:00
2026-08-31
510.07
507.29
2026-08-31 20:00
2026-09-01
503.61
501.02
2026-09-01 20:00
2026-09-02
497.76
496.82
2026-09-02 20:00
2026-09-03
512.63
510.12
2026-09-03 20:00
2026-09-04
500.58
499.70
2026-09-04 20:00
2026-09-08
493.27
493.95
2026-09-08 20:00
2026-09-09
491.69
491.65
2026-09-09 20:00
2026-09-10
493.07
492.44
2026-09-10 20:00
2026-09-11
498.52
495.63
2026-09-11 20:00
2026-09-14
508.54
505.41
2026-09-14 20:00
2026-09-15
498.86
497.12
2026-09-15 20:00
2026-09-16
494.48
490.30
2026-09-16 20:00
2026-09-17
500.28
497.75
2026-09-17 20:00
2026-09-18
496.33
493.78
2026-09-18 20:00
2026-09-21
503.22
501.61
2026-09-21 20:00
2026-09-22
501.25
498.00
2026-09-22 20:00
2026-09-23
503.06
500.59
2026-09-23 20:00
2026-09-24
501.07
497.93
2026-09-24 20:00
2026-09-25
518.98
516.17
2026-09-25 20:00
2026-09-28
511.70
509.22
2026-09-28 20:00
2026-09-29
512.06
508.96
2026-09-29 20:00
2026-09-30
515.27
512.90
2026-09-30 20:00
2026-10-01
516.84
512.80
2026-10-01 20:00
2026-10-02
519.95
517.53
2026-10-02 20:00
2026-10-05
527.35
525.18
2026-10-05 20:00
2026-10-06
532.35
529.30
2026-10-06 20:00
2026-10-07
532.01
529.76
2026-10-07 20:00
2026-10-08
525.93
522.61
2026-10-08 20:00
2026-10-09
537.45
535.07
2026-10-09 20:00
2026-10-12
543.48
541.15
2026-10-12 20:00
2026-10-13
546.06
543.45
2026-10-13 20:00
2026-10-14
535.70
533.69
2026-10-14 20:00
2026-10-15
542.43
539.44
2026-10-15 20:00
2026-10-16
531.87
529.05
2026-10-16 20:00
2026-10-19
535.69
533.52
2026-10-19 20:00
2026-10-20
535.30
531.87
2026-10-20 20:00
2026-10-21
535.87
532.95
2026-10-21 20:00
2026-10-22
524.11
521.08
2026-10-22 20:00
2026-10-23
525.75
524.51
2026-10-23 20:00
2026-10-26
534.07
532.60
2026-10-26 20:00
2026-10-27
533.36
531.33
2026-10-27 20:00
2026-10-28
533.14
531.01
2026-10-28 20:00
2026-10-29
533.09
530.14
2026-10-29 20:00
Stock history: Gloria · Retrieved Oct 30, 00:32 UTC. Token history: CoinGecko MSFTx.
Quoted token and share units can have different rights, multipliers and dividend treatment. This is not an executable premium or arbitrage signal.
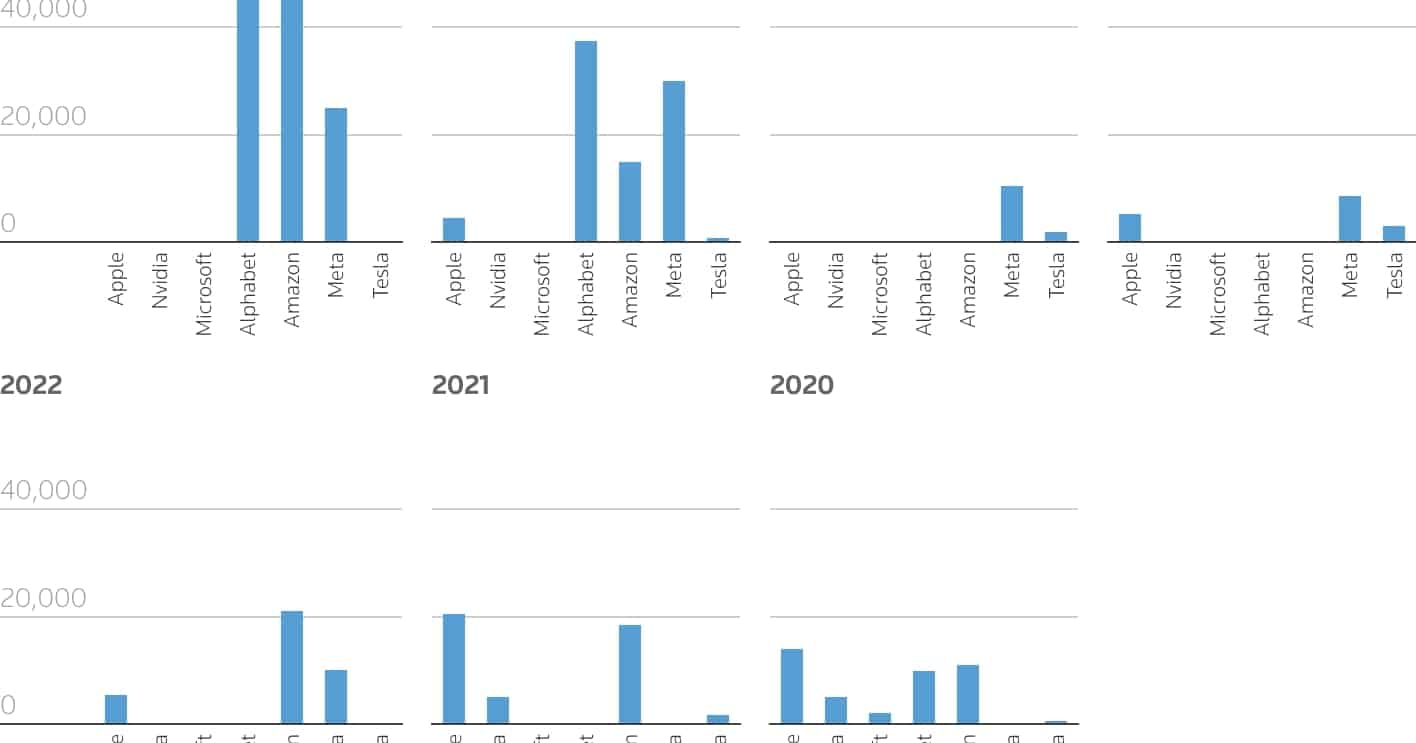
The Magnificent Seven, that now-familiar cluster of Apple, Microsoft, Nvidia, Amazon, Alphabet, Meta, and Tesla, delivered 21-22% earnings-per-share growth in recent quarters. That figure dwarfs what the rest of the S&P 500 managed. The engine behind it all: artificial intelligence, and specifically, the insatiable corporate appetite for the infrastructure to run it.
Nvidia leads, but the bill is coming due
Nvidia remains the clearest beneficiary of the AI gold rush. The chipmaker posted revenue growth exceeding 114% in fiscal year 2025, powered almost entirely by demand for its AI processors.
The hyperscalers, Microsoft, Amazon, Alphabet, and Meta, all reported strong top-line growth as well. Cloud computing divisions are expanding, AI product integrations are multiplying, and enterprise customers are lining up to pay for generative AI tools.
Capital expenditures across the major hyperscalers are projected to reach hundreds of billions of dollars annually, all directed at AI infrastructure and data centers. Microsoft and Amazon have both signaled that AI-related revenue is ramping, but the payback period on data center buildouts stretches years into the future.
Dispersion is the new concentration risk
Dispersion among the seven stocks’ earnings growth recently exceeded 50%. The gap between the best and worst performers in this group has gotten enormous. Nvidia posting triple-digit revenue growth while other members face decelerating momentum creates a very different investment thesis depending on which ticker you own.
The news moving money, markets, and the world—before your day starts.
Daily. Free. Join 34,000+ readers across crypto, finance, and policy.
Analysts are flagging a potential moderation in growth rates for some of these companies by 2026.
What this means for investors
The Magnificent Seven’s outsized contribution to S&P 500 EPS growth means passive index investors are, whether they realize it or not, making a massive bet on AI monetization.
According to LSEG data, earnings growth for the Magnificent Seven is projected to stabilize heading into 2027, still outpacing the broader S&P 500 but at a notably slower clip than the recent blistering pace.
The widening dispersion in performance suggests that investors will increasingly need to evaluate each company on its own merits: its specific AI strategy, its capital allocation discipline, and its ability to convert spending into durable cash flows.
Disclosure: This article was edited by Editorial Team. For more information on how we create and review content, see our Editorial Policy.