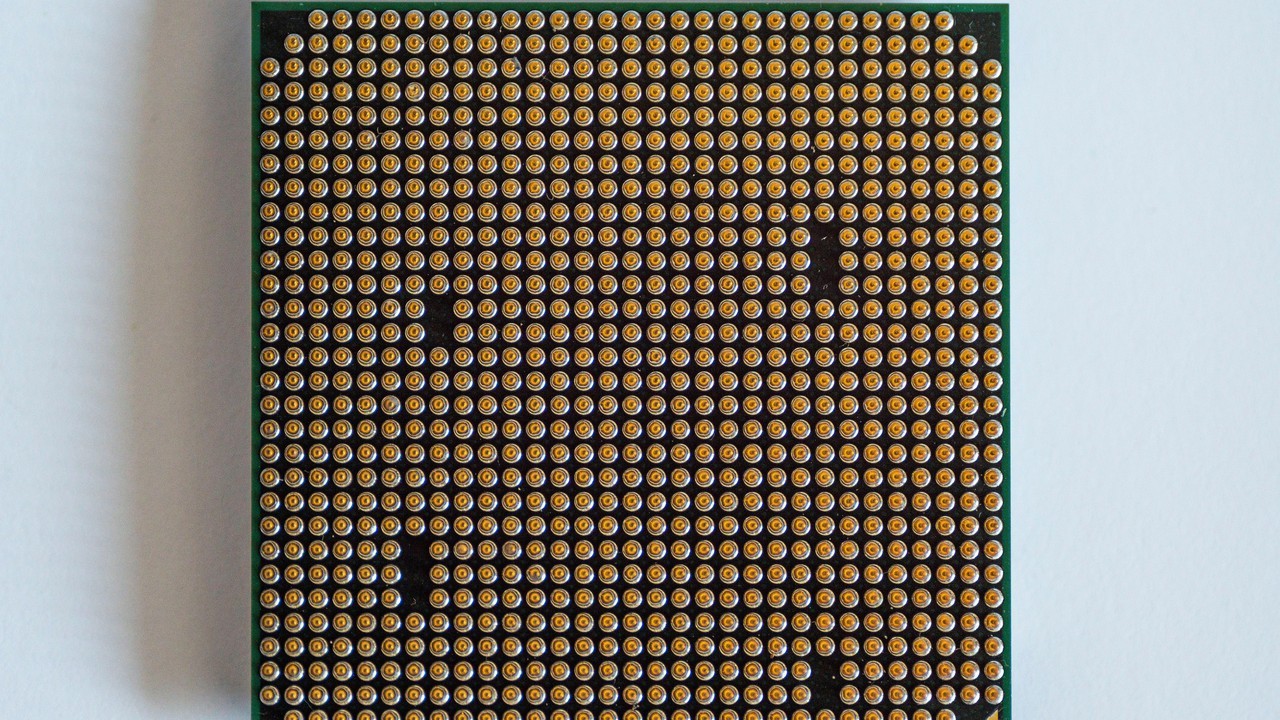
Mesh connects idle Nvidia GPUs into open AI compute network
Photo: SHOX ART / Pexels
The open-source project, backed by Jack Dorsey, lets anyone pool spare GPU power into a decentralized network for running large language models without touching a cloud provider.
+65.5% (FY ended 2026-01-25 vs FY ended 2025-01-26) 10-K
Annual net income
120,067,000,000 USD (FY ended 2026-01-25, attributable to the company) 10-K
Annual operating margin
60.4% (FY ended 2026-01-25)
Forward P/E
Unavailable: no dated forecast source
Gloria daily close for session Oct 27, 2026. Market cap and trailing P/E use this close with the SEC share total and trailing diluted earnings, each dated next to its figure. Annual revenue, revenue growth, net income and margin show their own fiscal period and link the 10-K. Current context may postdate this article.
4,335,000,000FY ended 2025-12-27, attributable to the company · 10-K
10.7%FY ended 2025-12-27
Missing figures stay unavailable. Forward P/E requires a dated source. Annual revenue, revenue growth, net income and margin come from each company's own 10-K, in US dollars, and each row shows that fiscal year. Revenue growth compares the fiscal year with the prior year stated in the same 10-K. Net income is the full year amount attributable to the company, or available to common stockholders where the filing states only that, or consolidated net income. Each row names its basis. Trailing P/E reads "Not meaningful" when the dated trailing diluted EPS is a loss or zero. An operating margin appears only when the filing states both the operating income and the revenue for the same year.
Sources: SEC filings, Gloria daily closes and CoinGecko. Oldest record refresh: Oct 27, 2026, 10:26 PM EDT. Refresh is not a price or filing date. Each row shows its price date and its annual fiscal period. Peers use industry code and company size, or editorial selection. Market cap multiplies that row price by the company share total the latest SEC filing states for every share class together. Trailing P/E divides it by trailing diluted earnings from SEC filings. Rolled earnings per share are approximate because share counts can change between periods. Both appear only when the SEC data carries its date, so they are estimates at one price date, not synchronized filing valuations. Not investment advice.
Token vs underlying stock
Current comparison for NVDA. Historical observations may postdate this article.
Split-adjusted regular-session stock closes from the existing Gloria shared history, paired only with an observed token price within 45 minutes of 16:00 New York time. Up to 60 matched sessions. No interpolation or missing-date fill. Weekends and known early closes are omitted. Token units are not adjusted for issuer multipliers or dividend treatment. This compares quoted prices, not fair value, executable premiums or arbitrage returns. Solid line: token. Dashed line: stock. Exact quote times and values appear below. Historical observations. Retrieval refers to the token source. Token quote times use UTC. The fixed cohort shows its oldest member fetch.
Nvidia token vs Nvidia stock: exact source values
Date (UTC)
Token (USD)
Stock close (USD)
Token quote (UTC)
2026-08-04
212.33
211.94
2026-08-04 20:00
2026-08-05
219.87
219.22
2026-08-05 20:00
2026-08-06
219.15
218.99
2026-08-06 20:00
2026-08-07
223.93
223.96
2026-08-07 20:00
2026-08-10
217.66
217.55
2026-08-10 20:00
2026-08-11
217.53
217.50
2026-08-11 20:00
2026-08-12
224.12
224.09
2026-08-12 20:00
2026-08-13
225.42
225.30
2026-08-13 20:00
2026-08-14
225.34
225.16
2026-08-14 20:00
2026-08-17
225.13
225.01
2026-08-17 20:00
2026-08-18
219.70
219.74
2026-08-18 20:00
2026-08-19
217.76
217.56
2026-08-19 20:00
2026-08-20
216.79
216.85
2026-08-20 20:00
2026-08-21
214.85
214.72
2026-08-21 20:00
2026-08-24
208.75
208.48
2026-08-24 20:00
2026-08-25
213.16
213.05
2026-08-25 20:00
2026-08-26
210.06
209.66
2026-08-26 20:00
2026-08-27
227.96
227.98
2026-08-27 20:00
2026-08-28
217.74
217.55
2026-08-28 20:00
2026-08-31
220.91
220.78
2026-08-31 20:00
2026-09-01
217.58
217.44
2026-09-01 20:00
2026-09-02
224.46
224.41
2026-09-02 20:00
2026-09-03
228.90
228.45
2026-09-03 20:00
2026-09-04
230.35
230.36
2026-09-04 20:00
2026-09-08
225.69
225.73
2026-09-08 20:00
2026-09-09
223.89
223.67
2026-09-09 20:00
2026-09-10
218.70
218.36
2026-09-10 20:00
2026-09-11
218.92
218.29
2026-09-11 20:00
2026-09-14
211.47
210.96
2026-09-14 20:00
2026-09-15
212.34
212.17
2026-09-15 20:00
2026-09-16
214.25
213.90
2026-09-16 20:00
2026-09-17
219.68
219.34
2026-09-17 20:00
2026-09-18
222.24
222.27
2026-09-18 20:00
2026-09-21
227.69
227.38
2026-09-21 20:00
2026-09-22
229.20
228.87
2026-09-22 20:00
2026-09-23
225.44
225.51
2026-09-23 20:00
2026-09-24
224.87
224.58
2026-09-24 20:00
2026-09-25
225.29
225.07
2026-09-25 20:00
2026-09-28
228.97
228.86
2026-09-28 20:00
2026-09-29
227.95
227.21
2026-09-29 20:00
2026-09-30
229.85
228.38
2026-09-30 20:00
2026-10-01
231.18
230.86
2026-10-01 20:00
2026-10-02
234.38
233.95
2026-10-02 20:00
2026-10-05
239.30
238.90
2026-10-05 20:00
2026-10-06
239.71
239.24
2026-10-06 20:00
2026-10-07
237.80
237.47
2026-10-07 20:00
2026-10-08
230.81
230.48
2026-10-08 20:00
2026-10-09
229.70
229.28
2026-10-09 20:00
2026-10-12
226.87
226.32
2026-10-12 20:00
2026-10-13
228.73
228.52
2026-10-13 20:00
2026-10-14
221.56
221.30
2026-10-14 20:00
2026-10-15
217.48
217.23
2026-10-15 20:00
2026-10-16
214.56
214.13
2026-10-16 20:00
2026-10-19
217.41
217.09
2026-10-19 20:00
2026-10-20
216.69
216.47
2026-10-20 20:00
2026-10-21
222.20
221.97
2026-10-21 20:00
2026-10-22
212.42
212.21
2026-10-22 20:00
2026-10-23
211.27
210.96
2026-10-23 20:00
2026-10-26
216.15
216.00
2026-10-26 20:00
2026-10-27
218.06
217.94
2026-10-27 20:00
Stock history: Gloria · Retrieved Oct 28, 00:31 UTC. Token history: CoinGecko NVDAx.
Quoted token and share units can have different rights, multipliers and dividend treatment. This is not an executable premium or arbitrage signal.
Running a 235 billion-parameter AI model used to require renting a small fortune’s worth of cloud compute. Mesh LLM wants you to do it with the GPUs already sitting in your house, your neighbor’s house, and maybe a few strangers on the internet.
The open-source project, led by developer Michael Neale and endorsed by Jack Dorsey, pools idle Nvidia GPUs across multiple machines into a peer-to-peer network capable of distributed inference on large language models.
How it actually works
Mesh LLM creates a decentralized mesh of GPUs spanning macOS, Linux, and Windows machines, with a heavy emphasis on Nvidia’s CUDA architecture. Instead of routing your AI queries to OpenAI’s or Google’s data centers, the system keeps everything local or distributed across connected nodes with zero central server involvement.
The project exposes an OpenAI-compatible API, which means developers can swap in Mesh as a drop-in replacement for cloud-hosted models without rewriting their applications. Under the hood, a novel pipeline approach called “Skippy” partitions massive models across multiple nodes. A 235 billion-parameter Mixture of Experts model, for instance, gets sliced up and spread across whatever hardware is available on the network.
Data transmission relies on the iroh P2P library, which handles NAT traversal, the networking headache that makes peer-to-peer connections difficult when devices sit behind routers and firewalls.
On a LAN setup, Mesh LLM achieves roughly 16 tokens per second on that 235B model. Over wide area networks, speeds range between 10 and 25 tokens per second.
AI, tech, and the markets they move—in one daily briefing.
Daily. Free. Join 34,000+ readers across crypto, finance, and policy.
The project supports dozens of open-weight model families, including Qwen, Llama, GLM, and DeepSeek variants.
The rewards layer
A related project called Meshtrain, launched on August 27, 2026, adds an incentive structure for GPU providers. Contributors who share their compute resources earn “MeshCoin” through a P2P local ledger.
That mainstream application is Block’s Buzz app, where Mesh has been integrated for community compute sharing. Block, the fintech company run by Dorsey, has been steadily expanding its footprint in both Bitcoin and decentralized infrastructure.
Privacy as a feature, not an afterthought
One of Mesh LLM’s core selling points is its zero-central-server architecture. When you run a model through the network, your data never touches an external data center.
Performance does take a hit on wide area networks compared to local setups. The architecture works best when nodes are geographically close and connected by low-latency links.
Disclosure: This article was edited by Editorial Team. For more information on how we create and review content, see our Editorial Policy.