+17.8% (FY ended 2026-06-30 vs FY ended 2025-06-30) 10-K
Annual net income
133,749,000,000 USD (FY ended 2026-06-30, attributable to the company) 10-K
Annual operating margin
46.8% (FY ended 2026-06-30)
Forward P/E
Unavailable: no dated forecast source
Gloria daily close for session Oct 28, 2026. Market cap and trailing P/E use this close with the SEC share total and trailing diluted earnings, each dated next to its figure. Annual revenue, revenue growth, net income and margin show their own fiscal period and link the 10-K. Current context may postdate this article.
−162,502,000FY ended 2026-01-31, attributable to the company · 10-K
−6.1%FY ended 2026-01-31
Missing figures stay unavailable. Forward P/E requires a dated source. Annual revenue, revenue growth, net income and margin come from each company's own 10-K, in US dollars, and each row shows that fiscal year. Revenue growth compares the fiscal year with the prior year stated in the same 10-K. Net income is the full year amount attributable to the company, or available to common stockholders where the filing states only that, or consolidated net income. Each row names its basis. Trailing P/E reads "Not meaningful" when the dated trailing diluted EPS is a loss or zero. An operating margin appears only when the filing states both the operating income and the revenue for the same year.
Sources: SEC filings, Gloria daily closes and CoinGecko. Oldest record refresh: Oct 28, 2026, 5:41 PM EDT. Refresh is not a price or filing date. Each row shows its price date and its annual fiscal period. Peers use industry code and company size, or editorial selection. Market cap multiplies that row price by the company share total the latest SEC filing states for every share class together. Trailing P/E divides it by trailing diluted earnings from SEC filings. Rolled earnings per share are approximate because share counts can change between periods. Both appear only when the SEC data carries its date, so they are estimates at one price date, not synchronized filing valuations. Not investment advice.
Token vs underlying stock
Current comparison for MSFT. Historical observations may postdate this article.
Split-adjusted regular-session stock closes from the existing Gloria shared history, paired only with an observed token price within 45 minutes of 16:00 New York time. Up to 60 matched sessions. No interpolation or missing-date fill. Weekends and known early closes are omitted. Token units are not adjusted for issuer multipliers or dividend treatment. This compares quoted prices, not fair value, executable premiums or arbitrage returns. Solid line: token. Dashed line: stock. Exact quote times and values appear below. Historical observations. Retrieval refers to the token source. Token quote times use UTC. The fixed cohort shows its oldest member fetch.
Microsoft token vs Microsoft stock: exact source values
Date (UTC)
Token (USD)
Stock close (USD)
Token quote (UTC)
2026-08-05
484.73
487.46
2026-08-05 20:00
2026-08-06
498.48
499.86
2026-08-06 20:00
2026-08-07
501.35
499.99
2026-08-07 20:00
2026-08-10
507.81
506.06
2026-08-10 20:00
2026-08-11
503.83
503.81
2026-08-11 20:00
2026-08-12
493.50
492.43
2026-08-12 20:00
2026-08-13
494.66
496.88
2026-08-13 20:00
2026-08-14
496.96
495.40
2026-08-14 20:00
2026-08-17
481.91
480.35
2026-08-17 20:00
2026-08-18
482.93
481.63
2026-08-18 20:00
2026-08-19
484.48
484.31
2026-08-19 20:00
2026-08-20
482.95
481.15
2026-08-20 20:00
2026-08-21
485.28
483.24
2026-08-21 20:00
2026-08-24
489.80
487.31
2026-08-24 20:00
2026-08-25
491.36
491.71
2026-08-25 20:00
2026-08-26
498.86
496.37
2026-08-26 20:00
2026-08-27
506.15
505.06
2026-08-27 20:00
2026-08-28
514.87
513.53
2026-08-28 20:00
2026-08-31
510.07
507.29
2026-08-31 20:00
2026-09-01
503.61
501.02
2026-09-01 20:00
2026-09-02
497.76
496.82
2026-09-02 20:00
2026-09-03
512.63
510.12
2026-09-03 20:00
2026-09-04
500.58
499.70
2026-09-04 20:00
2026-09-08
493.27
493.95
2026-09-08 20:00
2026-09-09
491.69
491.65
2026-09-09 20:00
2026-09-10
493.07
492.44
2026-09-10 20:00
2026-09-11
498.52
495.63
2026-09-11 20:00
2026-09-14
508.54
505.41
2026-09-14 20:00
2026-09-15
498.86
497.12
2026-09-15 20:00
2026-09-16
494.48
490.30
2026-09-16 20:00
2026-09-17
500.28
497.75
2026-09-17 20:00
2026-09-18
496.33
493.78
2026-09-18 20:00
2026-09-21
503.22
501.61
2026-09-21 20:00
2026-09-22
501.25
498.00
2026-09-22 20:00
2026-09-23
503.06
500.59
2026-09-23 20:00
2026-09-24
501.07
497.93
2026-09-24 20:00
2026-09-25
518.98
516.17
2026-09-25 20:00
2026-09-28
511.70
509.22
2026-09-28 20:00
2026-09-29
512.06
508.96
2026-09-29 20:00
2026-09-30
515.27
512.90
2026-09-30 20:00
2026-10-01
516.84
512.80
2026-10-01 20:00
2026-10-02
519.95
517.53
2026-10-02 20:00
2026-10-05
527.35
525.18
2026-10-05 20:00
2026-10-06
532.35
529.30
2026-10-06 20:00
2026-10-07
532.01
529.76
2026-10-07 20:00
2026-10-08
525.93
522.61
2026-10-08 20:00
2026-10-09
537.45
535.07
2026-10-09 20:00
2026-10-12
543.48
541.15
2026-10-12 20:00
2026-10-13
546.06
543.45
2026-10-13 20:00
2026-10-14
535.70
533.69
2026-10-14 20:00
2026-10-15
542.43
539.44
2026-10-15 20:00
2026-10-16
531.87
529.05
2026-10-16 20:00
2026-10-19
535.69
533.52
2026-10-19 20:00
2026-10-20
535.30
531.87
2026-10-20 20:00
2026-10-21
535.87
532.95
2026-10-21 20:00
2026-10-22
524.11
521.08
2026-10-22 20:00
2026-10-23
525.75
524.51
2026-10-23 20:00
2026-10-26
534.07
532.60
2026-10-26 20:00
2026-10-27
533.36
531.33
2026-10-27 20:00
2026-10-28
533.14
531.01
2026-10-28 20:00
Stock history: Gloria · Retrieved Oct 29, 00:31 UTC. Token history: CoinGecko MSFTx.
Quoted token and share units can have different rights, multipliers and dividend treatment. This is not an executable premium or arbitrage signal.
Microsoft and Nvidia just made the loudest joint statement yet about where AI is heading. At Microsoft Build 2026, held June 1-3, the two companies announced a unified accelerated computing stack designed to let developers build, run, and scale AI agents across Windows devices, Azure cloud, and local setups.
The centerpiece hardware is Nvidia’s RTX Spark lineup, a new generation of laptops and desktops that reportedly deliver 2x faster agentic inference on Windows devices. Think of it as giving your local machine enough horsepower to run sophisticated AI agents without constantly phoning home to a data center.
For enterprises that need serious muscle, there’s the DGX Station for Windows. This workstation supports AI models with up to 1 trillion parameters and offers up to 1 petaflop of AI computing power. For context, a petaflop is a quadrillion floating-point operations per second, the kind of performance that was reserved for national labs not long ago.
On the software side, two security-focused tools stood out. Nvidia’s OpenShell secure runtime and Microsoft’s eXecution Containers, called MXC, provide sandboxing capabilities for AI agents. In English: they create isolated environments where agents can operate without risking the broader system’s security.
The collaboration also extends into developer workflows. Integrations with GitHub Copilot and Microsoft Foundry are designed to make building these agents less painful, while GPU-accelerated Microsoft Fabric aims to supercharge data analytics pipelines.
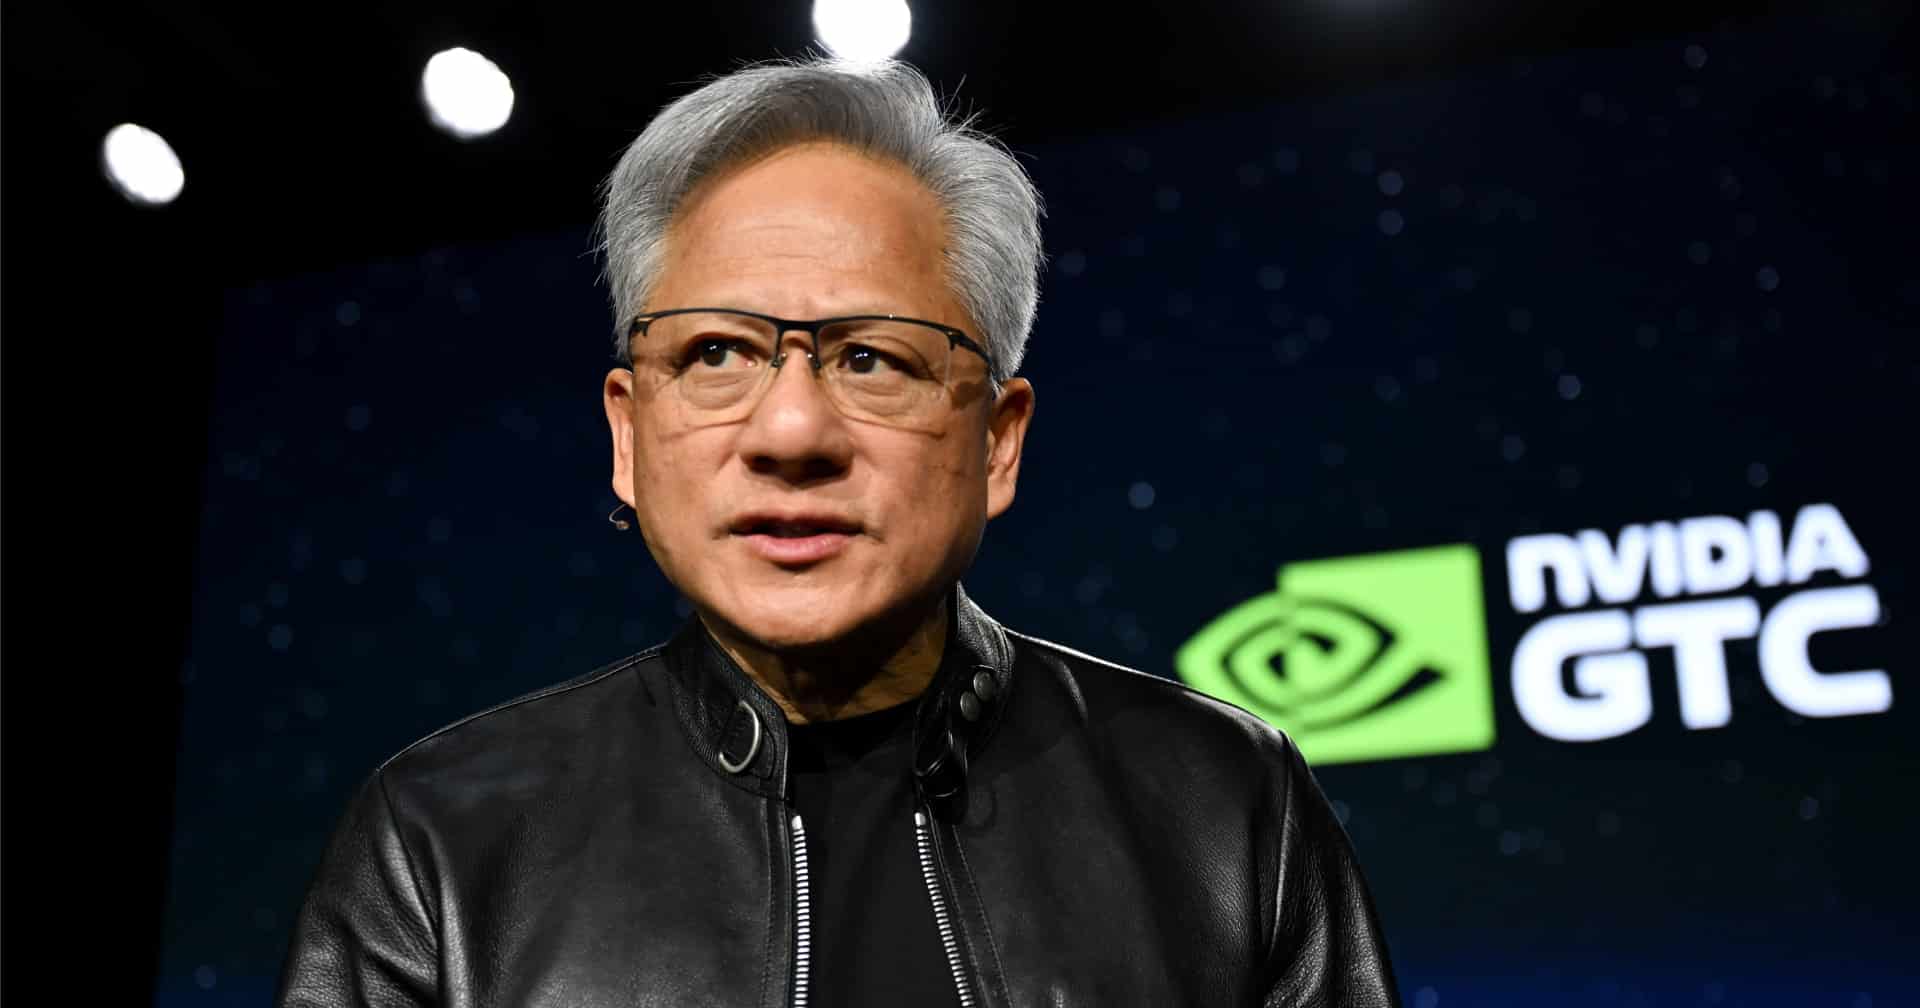
Jensen Huang and Satya Nadella both took the stage to emphasize what this partnership means. The collaboration itself isn’t new, spanning roughly three years of GPU acceleration discussions. But the scope has fundamentally shifted.
AI, tech, and the markets they move—in one daily briefing.
Daily. Free. Join 34,000+ readers across crypto, finance, and policy.
The Microsoft Foundry Agent Service, first introduced at GTC 2026, is now reaching general availability. That’s the plumbing that lets enterprises deploy production-ready AI agents at scale rather than treating them as science experiments.
The full-stack approach is notable. Most AI announcements focus on either the chip, the cloud, or the software layer. This one spans personal devices through enterprise cloud, which means a developer could prototype an agent on an RTX Spark laptop, test it locally, and then scale it to Azure without rearchitecting the whole thing.
The race to build agentic AI infrastructure is shaping capital flows across the entire tech sector. When Microsoft and Nvidia commit this deeply to a unified stack, it signals that enterprise AI spending is about to accelerate.
Decentralized compute projects, in particular, should be watching closely. Nvidia’s DGX Station offering 1 petaflop of local AI compute power changes the economics of who needs to rent GPU time from a network versus owning their own hardware.
The security angle is worth monitoring too. Nvidia’s OpenShell and Microsoft’s MXC containers address one of the biggest concerns enterprises have about deploying autonomous agents. Crypto projects building agent frameworks have largely punted on this question. The centralized world just gave a clear answer, and decentralized alternatives will eventually need their own.
The three-year evolution of this partnership also tells us something about timing. Enterprise AI adoption cycles are long and deliberate.
Disclosure: This article was edited by Editorial Team. For more information on how we create and review content, see our Editorial Policy.