+15.1% (FY ended 2025-12-31 vs FY ended 2024-12-31) 10-K
Annual net income
132,170,000,000 USD (FY ended 2025-12-31, attributable to the company) 10-K
Annual operating margin
32.0% (FY ended 2025-12-31)
Forward P/E
Unavailable: no dated forecast source
Gloria daily close for session Oct 27, 2026. Market cap and trailing P/E use this close with the SEC share total and trailing diluted earnings, each dated next to its figure. Annual revenue, revenue growth, net income and margin show their own fiscal period and link the 10-K. Current context may postdate this article.
Alphabet Inc. and its peers
Company
Price
Market cap
P/E (trailing)
Forward P/E
Annual revenue (USD)
Annual revenue growth
Annual net income (USD)
Operating margin
Alphabet Inc.
GOOGL · Price dated Oct 27, 2026 · tokenized GOOGLx
3,333,751,000FY ended 2025-12-31, attributable to the company · 10-K
75.8%FY ended 2025-12-31
Missing figures stay unavailable. Forward P/E requires a dated source. Annual revenue, revenue growth, net income and margin come from each company's own 10-K, in US dollars, and each row shows that fiscal year. Revenue growth compares the fiscal year with the prior year stated in the same 10-K. Net income is the full year amount attributable to the company, or available to common stockholders where the filing states only that, or consolidated net income. Each row names its basis. Trailing P/E reads "Not meaningful" when the dated trailing diluted EPS is a loss or zero. An operating margin appears only when the filing states both the operating income and the revenue for the same year.
Sources: SEC filings, Gloria daily closes and CoinGecko. Oldest record refresh: Oct 27, 2026, 10:51 PM EDT. Refresh is not a price or filing date. Each row shows its price date and its annual fiscal period. Peers use industry code and company size, or editorial selection. Market cap multiplies that row price by the company share total the latest SEC filing states for every share class together. Trailing P/E divides it by trailing diluted earnings from SEC filings. Rolled earnings per share are approximate because share counts can change between periods. Both appear only when the SEC data carries its date, so they are estimates at one price date, not synchronized filing valuations. Not investment advice.
Token vs underlying stock
Current comparison for GOOGL. Historical observations may postdate this article.
Split-adjusted regular-session stock closes from the existing Gloria shared history, paired only with an observed token price within 45 minutes of 16:00 New York time. Up to 60 matched sessions. No interpolation or missing-date fill. Weekends and known early closes are omitted. Token units are not adjusted for issuer multipliers or dividend treatment. This compares quoted prices, not fair value, executable premiums or arbitrage returns. Solid line: token. Dashed line: stock. Exact quote times and values appear below. Historical observations. Retrieval refers to the token source. Token quote times use UTC. The fixed cohort shows its oldest member fetch.
Alphabet token vs Alphabet stock: exact source values
Quoted token and share units can have different rights, multipliers and dividend treatment. This is not an executable premium or arbitrage signal.
Wall Street has a new favorite insurance policy, and it’s written against the companies everyone supposedly loves the most.
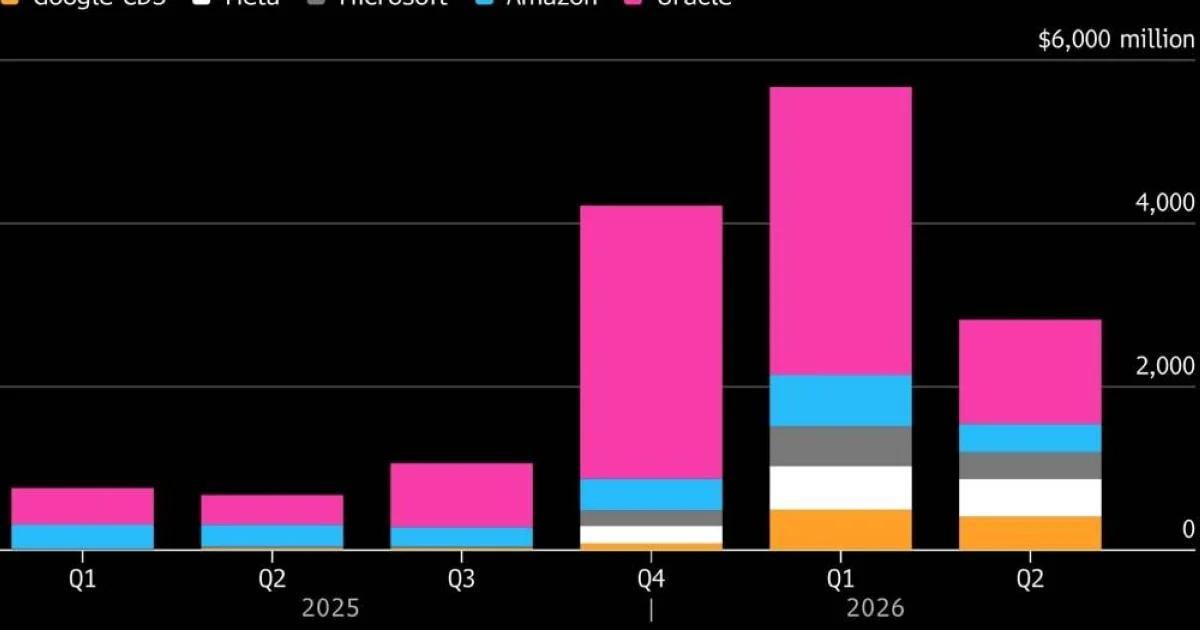
Credit default swaps tied to major US tech firms have exploded in volume, with exposure growing 90% since September 2025 according to data from the Depository Trust & Clearing Corporation. Weekly CDS trading volumes hit roughly $8 billion in December 2025, the highest level ever recorded.
The AI debt binge that spooked the bond market
The hyperscalers, Alphabet, Amazon, Meta, Microsoft, and Oracle, collectively issued approximately $121 billion in new debt during 2025. That capital went toward AI infrastructure and data centers, the physical backbone required to train and deploy increasingly powerful models.
Oracle emerges as the focal point
Among the five hyperscalers, Oracle has drawn the most intense scrutiny from credit traders. CDS activity on Oracle more than tripled throughout 2025, with protection costs reaching multi-year highs.
Meta has also attracted heightened CDS interest. The company’s pivot toward AI infrastructure, layered on top of its ongoing metaverse investments, has created a capital expenditure profile that would have been unthinkable even three years ago.
JPMorgan Chase launched a dedicated synthetic CDS basket covering all five AI hyperscalers: Alphabet, Amazon, Meta, Microsoft, and Oracle, letting institutional investors hedge against AI-related debt risk across the entire cohort, rather than buying protection company by company.
The news moving money, markets, and the world—before your day starts.
Daily. Free. Join 34,000+ readers across crypto, finance, and policy.
The surge in CDS activity signals a psychological shift on Wall Street. The question has evolved from “how much will AI make these companies?” to “can these companies earn enough return on $121 billion in borrowed capital to justify the risk?”
The 90% increase in CDS exposure since September alone suggests this isn’t a slow drift. It’s a rapid recalibration of how institutions are thinking about concentration risk in the tech sector.
What this means for investors
Rising credit spreads increase the cost of future borrowing for these companies. If hyperscalers need to return to bond markets in 2026, the price of that capital will be higher.
The creation of dedicated hedging products like JPMorgan’s CDS basket suggests that institutional investors view AI-related debt as a distinct asset class with its own risk profile. More hedging tools mean more liquidity and better price discovery, but they also make it easier for large positions to unwind quickly if sentiment turns.
For crypto-native investors, the connection is indirect but real. A meaningful repricing of risk in Big Tech credit could tighten financial conditions more broadly, reducing the kind of risk appetite that has historically fueled flows into digital assets.
Disclosure: This article was edited by Editorial Team. For more information on how we create and review content, see our Editorial Policy.