+12.4% (FY ended 2025-12-31 vs FY ended 2024-12-31) 10-K
Annual net income
77,670,000,000 USD (FY ended 2025-12-31, attributable to the company) 10-K
Annual operating margin
11.2% (FY ended 2025-12-31)
Forward P/E
Unavailable: no dated forecast source
Gloria daily close for session Oct 28, 2026. Market cap and trailing P/E use this close with the SEC share total and trailing diluted earnings, each dated next to its figure. Annual revenue, revenue growth, net income and margin show their own fiscal period and link the 10-K. Current context may postdate this article.
Amazon.com Inc. and its peers
Company
Price
Market cap
P/E (trailing)
Forward P/E
Annual revenue (USD)
Annual revenue growth
Annual net income (USD)
Operating margin
Amazon.com Inc.
AMZN · Price dated Oct 28, 2026 · tokenized AMZNx
21,893,000,000FY ended 2026-01-31, attributable to the company · 10-K
4.2%FY ended 2026-01-31
Missing figures stay unavailable. Forward P/E requires a dated source. Annual revenue, revenue growth, net income and margin come from each company's own 10-K, in US dollars, and each row shows that fiscal year. Revenue growth compares the fiscal year with the prior year stated in the same 10-K. Net income is the full year amount attributable to the company, or available to common stockholders where the filing states only that, or consolidated net income. Each row names its basis. Trailing P/E reads "Not meaningful" when the dated trailing diluted EPS is a loss or zero. An operating margin appears only when the filing states both the operating income and the revenue for the same year.
Sources: SEC filings, Gloria daily closes and CoinGecko. Oldest record refresh: Oct 28, 2026, 3:46 PM EDT. Refresh is not a price or filing date. Each row shows its price date and its annual fiscal period. Peers use industry code and company size, or editorial selection. Market cap multiplies that row price by the company share total the latest SEC filing states for every share class together. Trailing P/E divides it by trailing diluted earnings from SEC filings. Rolled earnings per share are approximate because share counts can change between periods. Both appear only when the SEC data carries its date, so they are estimates at one price date, not synchronized filing valuations. Not investment advice.
Token vs underlying stock
Current comparison for AMZN. Historical observations may postdate this article.
Split-adjusted regular-session stock closes from the existing Gloria shared history, paired only with an observed token price within 45 minutes of 16:00 New York time. Up to 60 matched sessions. No interpolation or missing-date fill. Weekends and known early closes are omitted. Token units are not adjusted for issuer multipliers or dividend treatment. This compares quoted prices, not fair value, executable premiums or arbitrage returns. Solid line: token. Dashed line: stock. Exact quote times and values appear below. Historical observations. Retrieval refers to the token source. Token quote times use UTC. The fixed cohort shows its oldest member fetch.
Amazon token vs Amazon stock: exact source values
Date (UTC)
Token (USD)
Stock close (USD)
Token quote (UTC)
2026-08-05
272.84
272.65
2026-08-05 20:00
2026-08-06
272.13
272.26
2026-08-06 20:00
2026-08-07
274.76
274.48
2026-08-07 20:00
2026-08-10
277.96
278.09
2026-08-10 20:00
2026-08-11
272.21
272.27
2026-08-11 20:00
2026-08-12
267.48
267.28
2026-08-12 20:00
2026-08-13
265.07
265.13
2026-08-13 20:00
2026-08-14
262.81
262.65
2026-08-14 20:00
2026-08-17
261.07
261.31
2026-08-17 20:00
2026-08-18
259.40
259.45
2026-08-18 20:00
2026-08-19
265.80
265.84
2026-08-19 20:00
2026-08-20
259.95
260.11
2026-08-20 20:00
2026-08-21
258.73
258.63
2026-08-21 20:00
2026-08-24
262.28
262.07
2026-08-24 20:00
2026-08-25
261.06
261.06
2026-08-25 20:00
2026-08-26
260.32
260.28
2026-08-26 20:00
2026-08-27
256.30
256.26
2026-08-27 20:00
2026-08-28
266.44
266.43
2026-08-28 20:00
2026-08-31
259.63
259.77
2026-08-31 20:00
2026-09-01
254.64
254.92
2026-09-01 20:00
2026-09-02
254.81
254.98
2026-09-02 20:00
2026-09-03
258.83
258.90
2026-09-03 20:00
2026-09-04
258.34
258.51
2026-09-04 20:00
2026-09-08
256.81
256.97
2026-09-08 20:00
2026-09-09
252.24
252.40
2026-09-09 20:00
2026-09-10
251.61
251.89
2026-09-10 20:00
2026-09-11
257.13
256.78
2026-09-11 20:00
2026-09-14
253.68
253.54
2026-09-14 20:00
2026-09-15
248.35
248.42
2026-09-15 20:00
2026-09-16
246.01
245.96
2026-09-16 20:00
2026-09-17
251.35
251.19
2026-09-17 20:00
2026-09-18
253.69
253.71
2026-09-18 20:00
2026-09-21
258.31
258.45
2026-09-21 20:00
2026-09-22
255.06
254.98
2026-09-22 20:00
2026-09-23
249.39
249.27
2026-09-23 20:00
2026-09-24
249.48
249.38
2026-09-24 20:00
2026-09-25
249.71
249.67
2026-09-25 20:00
2026-09-28
246.30
246.15
2026-09-28 20:00
2026-09-29
246.66
246.67
2026-09-29 20:00
2026-09-30
249.53
249.15
2026-09-30 20:00
2026-10-01
248.17
248.23
2026-10-01 20:00
2026-10-02
251.37
251.52
2026-10-02 20:00
2026-10-05
251.43
251.40
2026-10-05 20:00
2026-10-06
256.28
256.29
2026-10-06 20:00
2026-10-07
259.85
259.92
2026-10-07 20:00
2026-10-08
254.31
254.06
2026-10-08 20:00
2026-10-09
262.35
262.43
2026-10-09 20:00
2026-10-12
259.60
259.53
2026-10-12 20:00
2026-10-13
258.72
258.58
2026-10-13 20:00
2026-10-14
253.89
254.08
2026-10-14 20:00
2026-10-15
254.89
254.76
2026-10-15 20:00
2026-10-16
250.16
250.00
2026-10-16 20:00
2026-10-19
262.52
262.45
2026-10-19 20:00
2026-10-20
262.57
262.63
2026-10-20 20:00
2026-10-21
262.57
262.37
2026-10-21 20:00
2026-10-22
250.30
250.38
2026-10-22 20:00
2026-10-23
248.07
248.00
2026-10-23 20:00
2026-10-26
248.95
249.09
2026-10-26 20:00
2026-10-27
253.41
253.10
2026-10-27 20:00
2026-10-28
254.56
254.60
2026-10-28 20:00
Stock history: Gloria · Retrieved Oct 29, 00:31 UTC. Token history: CoinGecko AMZNx.
Quoted token and share units can have different rights, multipliers and dividend treatment. This is not an executable premium or arbitrage signal.
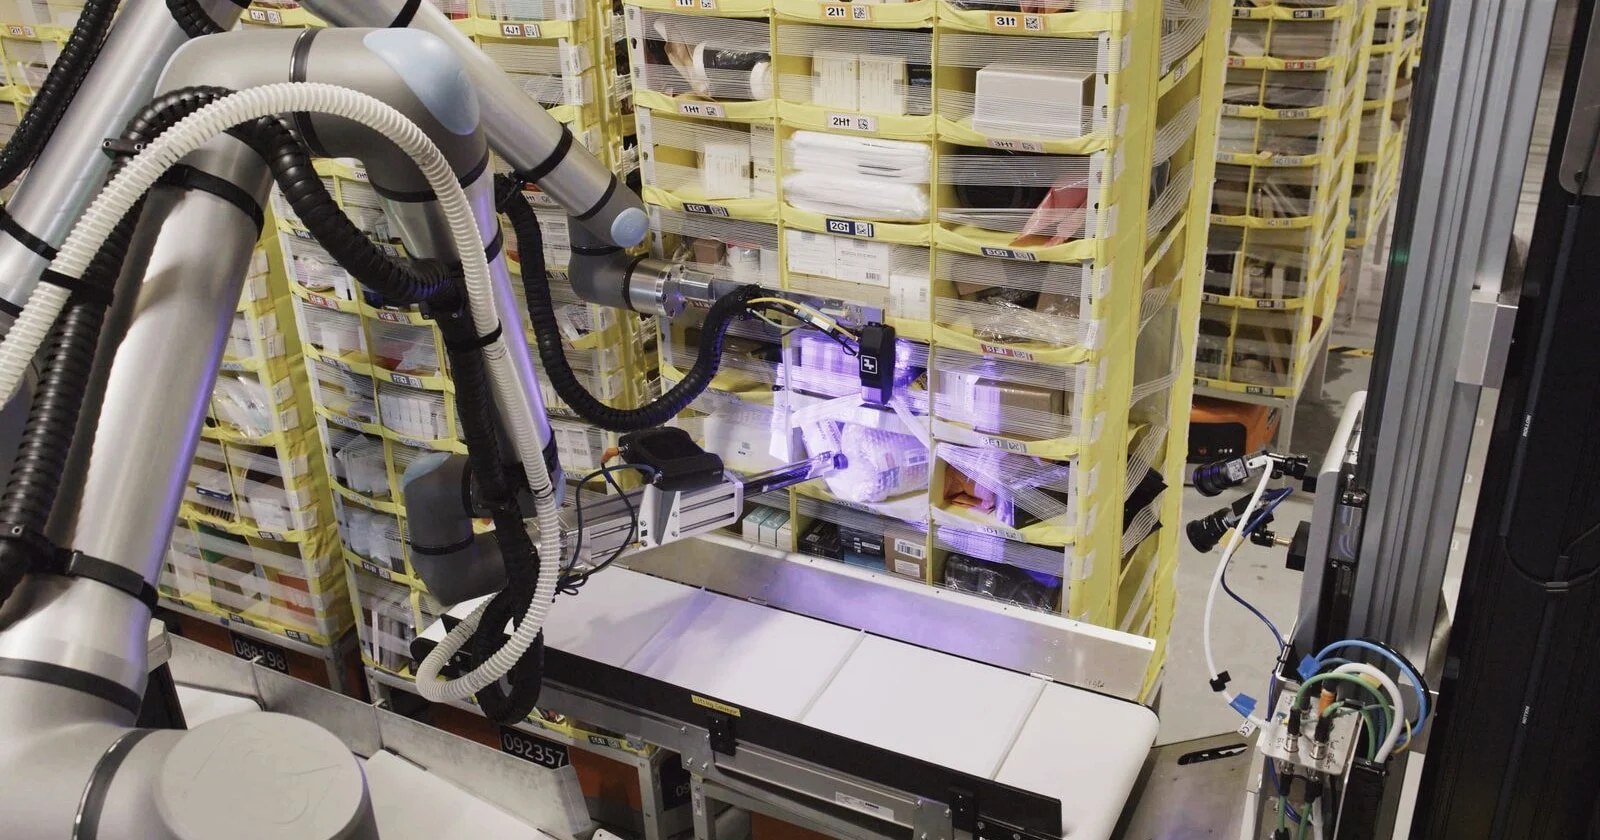
Amazon unveiled Vulcan, its first robotic system equipped with tactile and force-sensing capabilities, at the “Delivering the Future” event in Dortmund, Germany on May 7, 2025. Unlike previous vision-only systems, Vulcan can detect physical contact and measure the force it applies in real time, letting it pick up, move, and stow a wide variety of items without crushing, dropping, or otherwise mangling them.
What Vulcan actually does
Vulcan uses force-feedback sensors to understand what it’s touching. The robot can feel whether it has a solid grip on something, adjust its squeeze in real time, and adapt its approach based on physical feedback rather than just visual cues.
The system uses arms supplied by Universal Robots, the Denmark-based robotics firm that Teradyne acquired in 2015. Those arms, combined with Amazon’s proprietary AI layer, give Vulcan the dexterity to handle approximately 75% of items found in fulfillment centers at speeds on par with human workers.
During initial testing, Vulcan processed over 12,000 customer orders. The system is currently operational at testing sites in Spokane, Washington, and Hamburg, Germany.
Vulcan can only handle objects weighing up to roughly 8 pounds (3.6 kg), and it struggles with some round items.
The news moving money, markets, and the world—before your day starts.
Daily. Free. Join 34,000+ readers across crypto, finance, and policy.
Development was led by Aaron Parness, Amazon’s director of robotics AI. Vulcan improves its performance through machine learning trained on physical force and touch data. Every time it picks up an item, it’s collecting information about grip pressure, object resistance, and surface texture.
Amazon has framed Vulcan as a complement to human workers, not a replacement. The company says the system is designed to relieve employees of physically demanding tasks like repeated stretching, bending, and heavy lifting.
What this means for investors and the industry
The partnership with Universal Robots is worth watching. Teradyne’s subsidiary has carved out a strong position in the collaborative robotics market, and a deep integration with Amazon’s fulfillment infrastructure could significantly boost demand for their hardware.
Amazon operates hundreds of fulfillment centers globally. If Vulcan can handle 75% of items at human-equivalent speeds, Amazon can meaningfully reduce per-unit fulfillment costs across those sites.
The 8-pound weight limit and difficulty with round objects suggest Vulcan is still a first-generation system. Investors should watch for expansion beyond the two current test sites in Spokane and Hamburg as a signal that the technology is ready for broader deployment.
Disclosure: This article was edited by Editorial Team. For more information on how we create and review content, see our Editorial Policy.