Meta launches $115M America’s Workforce Academy to train future technicians with guaranteed jobs
The five-week program covers everything from training to transportation, targeting skilled trades workers for data center construction across four states.
+22.2% (FY ended 2025-12-31 vs FY ended 2024-12-31) 10-K
Annual net income
60,458,000,000 USD (FY ended 2025-12-31, attributable to the company) 10-K
Annual operating margin
41.4% (FY ended 2025-12-31)
Forward P/E
Unavailable: no dated forecast source
Gloria daily close for session Oct 27, 2026. Market cap and trailing P/E use this close with the SEC share total and trailing diluted earnings, each dated next to its figure. Annual revenue, revenue growth, net income and margin show their own fiscal period and link the 10-K. Current context may postdate this article.
3,333,751,000FY ended 2025-12-31, attributable to the company · 10-K
75.8%FY ended 2025-12-31
Missing figures stay unavailable. Forward P/E requires a dated source. Annual revenue, revenue growth, net income and margin come from each company's own 10-K, in US dollars, and each row shows that fiscal year. Revenue growth compares the fiscal year with the prior year stated in the same 10-K. Net income is the full year amount attributable to the company, or available to common stockholders where the filing states only that, or consolidated net income. Each row names its basis. Trailing P/E reads "Not meaningful" when the dated trailing diluted EPS is a loss or zero. An operating margin appears only when the filing states both the operating income and the revenue for the same year.
Sources: SEC filings, Gloria daily closes and CoinGecko. Oldest record refresh: Oct 27, 2026, 10:51 PM EDT. Refresh is not a price or filing date. Each row shows its price date and its annual fiscal period. Peers use industry code and company size, or editorial selection. Market cap multiplies that row price by the company share total the latest SEC filing states for every share class together. Trailing P/E divides it by trailing diluted earnings from SEC filings. Rolled earnings per share are approximate because share counts can change between periods. Both appear only when the SEC data carries its date, so they are estimates at one price date, not synchronized filing valuations. Not investment advice.
Token vs underlying stock
Current comparison for META. Historical observations may postdate this article.
Split-adjusted regular-session stock closes from the existing Gloria shared history, paired only with an observed token price within 45 minutes of 16:00 New York time. Up to 60 matched sessions. No interpolation or missing-date fill. Weekends and known early closes are omitted. Token units are not adjusted for issuer multipliers or dividend treatment. This compares quoted prices, not fair value, executable premiums or arbitrage returns. Solid line: token. Dashed line: stock. Exact quote times and values appear below. Historical observations. Retrieval refers to the token source. Token quote times use UTC. The fixed cohort shows its oldest member fetch.
Meta token vs Meta stock: exact source values
Date (UTC)
Token (USD)
Stock close (USD)
Token quote (UTC)
2026-08-04
589.37
587.94
2026-08-04 20:00
2026-08-05
590.76
588.77
2026-08-05 20:00
2026-08-06
589.91
589.90
2026-08-06 20:00
2026-08-07
592.96
592.10
2026-08-07 20:00
2026-08-10
595.64
594.92
2026-08-10 20:00
2026-08-11
600.42
599.12
2026-08-11 20:00
2026-08-12
580.52
578.85
2026-08-12 20:00
2026-08-13
595.84
594.97
2026-08-13 20:00
2026-08-14
590.73
589.85
2026-08-14 20:00
2026-08-17
569.77
568.97
2026-08-17 20:00
2026-08-18
544.97
543.67
2026-08-18 20:00
2026-08-19
547.78
546.03
2026-08-19 20:00
2026-08-20
547.56
545.83
2026-08-20 20:00
2026-08-21
551.35
549.90
2026-08-21 20:00
2026-08-24
560.74
559.02
2026-08-24 20:00
2026-08-25
571.26
570.05
2026-08-25 20:00
2026-08-26
577.62
576.14
2026-08-26 20:00
2026-08-27
572.41
571.10
2026-08-27 20:00
2026-08-28
579.18
578.02
2026-08-28 20:00
2026-08-31
573.08
572.34
2026-08-31 20:00
2026-09-01
579.55
578.54
2026-09-01 20:00
2026-09-02
593.44
592.85
2026-09-02 20:00
2026-09-03
612.22
610.68
2026-09-03 20:00
2026-09-04
617.78
616.77
2026-09-04 20:00
2026-09-08
614.55
613.48
2026-09-08 20:00
2026-09-09
653.99
653.69
2026-09-09 20:00
2026-09-10
645.68
644.38
2026-09-10 20:00
2026-09-11
648.82
648.03
2026-09-11 20:00
2026-09-14
667.33
665.60
2026-09-14 20:00
2026-09-15
671.72
670.24
2026-09-15 20:00
2026-09-16
674.78
673.31
2026-09-16 20:00
2026-09-17
683.69
682.31
2026-09-17 20:00
2026-09-18
667.45
665.75
2026-09-18 20:00
2026-09-21
743.56
741.25
2026-09-21 20:00
2026-09-22
740.44
736.60
2026-09-22 20:00
2026-09-23
746.35
744.10
2026-09-23 20:00
2026-09-24
778.30
777.59
2026-09-24 20:00
2026-09-25
752.94
751.66
2026-09-25 20:00
2026-09-28
716.77
715.62
2026-09-28 20:00
2026-09-29
741.08
738.79
2026-09-29 20:00
2026-09-30
728.60
725.18
2026-09-30 20:00
2026-10-01
727.20
725.93
2026-10-01 20:00
2026-10-02
729.17
728.08
2026-10-02 20:00
2026-10-05
743.97
741.90
2026-10-05 20:00
2026-10-06
741.44
738.88
2026-10-06 20:00
2026-10-07
722.75
721.31
2026-10-07 20:00
2026-10-08
722.91
720.89
2026-10-08 20:00
2026-10-09
720.22
718.67
2026-10-09 20:00
2026-10-12
744.29
742.96
2026-10-12 20:00
2026-10-13
764.47
762.50
2026-10-13 20:00
2026-10-14
737.37
737.54
2026-10-14 20:00
2026-10-15
738.03
736.72
2026-10-15 20:00
2026-10-16
711.14
709.33
2026-10-16 20:00
2026-10-19
707.00
705.44
2026-10-19 20:00
2026-10-20
695.35
694.25
2026-10-20 20:00
2026-10-21
700.90
697.52
2026-10-21 20:00
2026-10-22
650.24
648.85
2026-10-22 20:00
2026-10-23
643.78
642.62
2026-10-23 20:00
2026-10-26
631.24
630.56
2026-10-26 20:00
2026-10-27
621.46
620.19
2026-10-27 20:00
Stock history: Gloria · Retrieved Oct 28, 00:31 UTC. Token history: CoinGecko METAx.
Quoted token and share units can have different rights, multipliers and dividend treatment. This is not an executable premium or arbitrage signal.
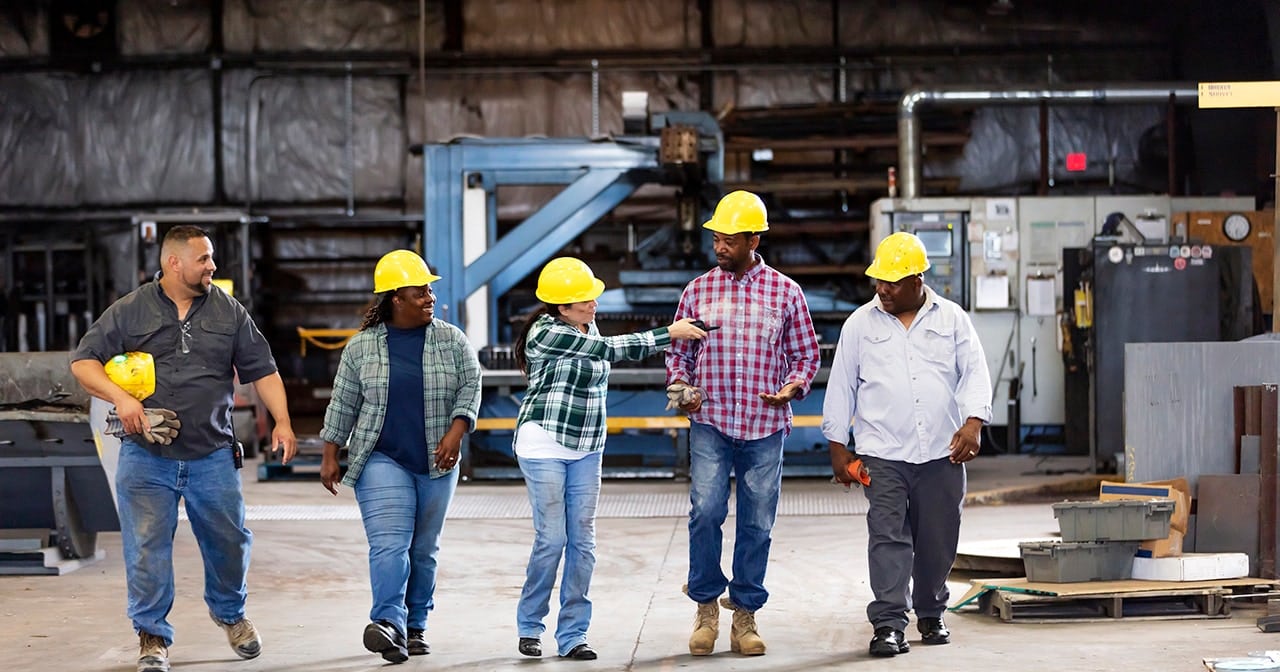
Meta is throwing $115 million at a problem that money alone usually can’t solve: finding enough people who know how to wire, weld, and build the physical backbone of its AI empire.
The company unveiled America’s Workforce Academy on June 8, a free five-week training program that doesn’t just waive tuition. It covers certification fees, transportation costs, and actually pays attendees a stipend while they learn. Graduates get something vanishingly rare in corporate training programs: a guaranteed job.
What Meta is actually building
The program targets five specific trades: electricians, welders, plumbers, fiber technicians, and general construction roles. No prior experience is required. The initial rollout focuses on Louisiana, Ohio, Indiana, and Texas, all states where Meta is establishing new data center facilities.
The construction industry faces an estimated 349,000-worker gap by the end of 2026, and the company’s aggressive AI infrastructure expansion is competing for a labor pool that was already running dry.
Partners include the Associated Builders and Contractors (ABC) and CBRE, two organizations with deep roots in commercial construction and facilities management.
The news moving money, markets, and the world—before your day starts.
Daily. Free. Join 34,000+ readers across crypto, finance, and policy.
The timing is worth noting. Meta laid off 8,000 employees in May 2026, part of a broader reallocation toward AI spending. Cutting thousands of knowledge workers one month and launching a massive blue-collar hiring initiative the next tells you everything about where Meta sees its bottleneck.
The $115 million price tag covers just the 2026 launch year.
Why this matters beyond Meta’s hiring needs
The guaranteed-job model is particularly significant. Traditional workforce development programs have long struggled with a credibility gap. By attaching explicit employment commitments to the program, Meta is setting a standard that other companies will either have to match or explain why they can’t.
The 349,000-worker gap isn’t just a statistic. It’s a constraint on how fast any company, in any sector, can build out physical computing capacity. Programs like AWA either help close that gap or simply redirect existing labor toward Meta’s projects, potentially tightening supply for everyone else.
Disclosure: This article was edited by Editorial Team. For more information on how we create and review content, see our Editorial Policy.