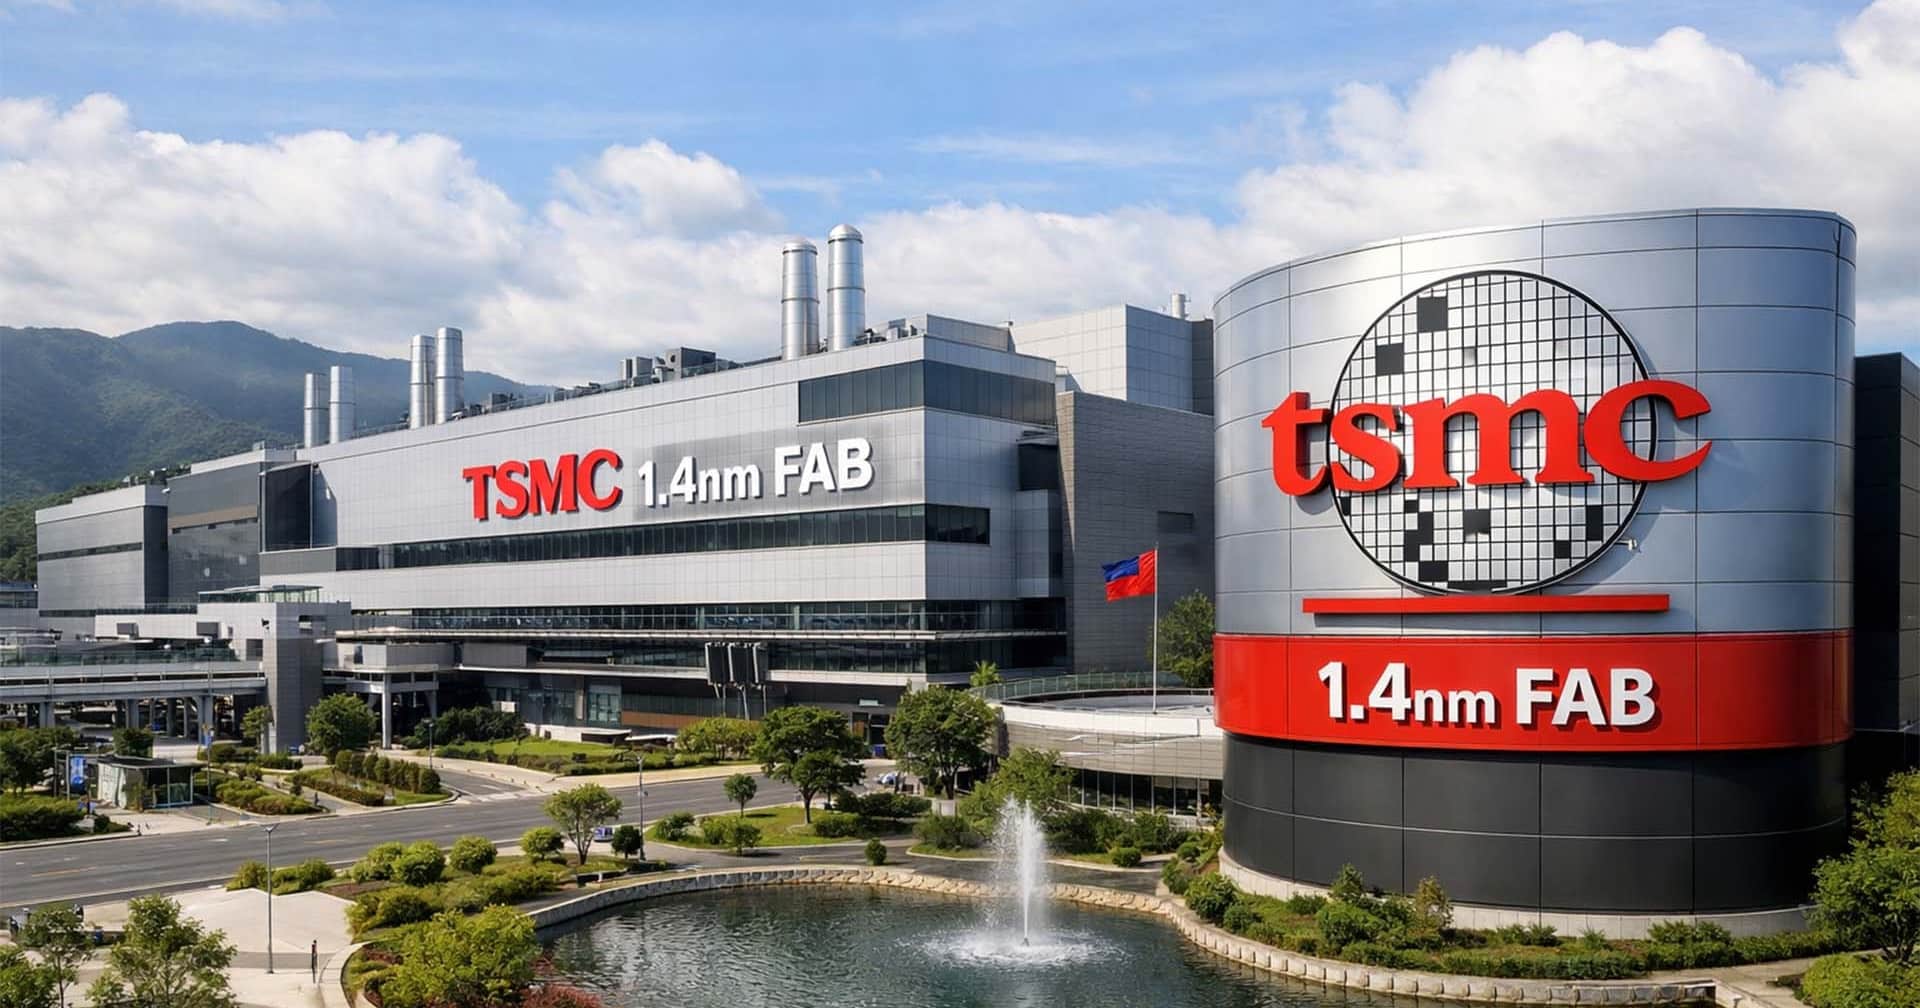
CEO C.C. Wei says the world's largest chipmaker treats customers as partners, not revenue targets, even as AI demand outstrips supply for years to come.
+65.5% (FY ended 2026-01-25 vs FY ended 2025-01-26) 10-K
Annual net income
120,067,000,000 USD (FY ended 2026-01-25, attributable to the company) 10-K
Annual operating margin
60.4% (FY ended 2026-01-25)
Forward P/E
Unavailable: no dated forecast source
Gloria daily close for session Oct 28, 2026. Market cap and trailing P/E use this close with the SEC share total and trailing diluted earnings, each dated next to its figure. Annual revenue, revenue growth, net income and margin show their own fiscal period and link the 10-K. Current context may postdate this article.
4,335,000,000FY ended 2025-12-27, attributable to the company · 10-K
10.7%FY ended 2025-12-27
Missing figures stay unavailable. Forward P/E requires a dated source. Annual revenue, revenue growth, net income and margin come from each company's own 10-K, in US dollars, and each row shows that fiscal year. Revenue growth compares the fiscal year with the prior year stated in the same 10-K. Net income is the full year amount attributable to the company, or available to common stockholders where the filing states only that, or consolidated net income. Each row names its basis. Trailing P/E reads "Not meaningful" when the dated trailing diluted EPS is a loss or zero. An operating margin appears only when the filing states both the operating income and the revenue for the same year.
Sources: SEC filings, Gloria daily closes and CoinGecko. Oldest record refresh: Oct 28, 2026, 5:46 PM EDT. Refresh is not a price or filing date. Each row shows its price date and its annual fiscal period. Peers use industry code and company size, or editorial selection. Market cap multiplies that row price by the company share total the latest SEC filing states for every share class together. Trailing P/E divides it by trailing diluted earnings from SEC filings. Rolled earnings per share are approximate because share counts can change between periods. Both appear only when the SEC data carries its date, so they are estimates at one price date, not synchronized filing valuations. Not investment advice.
Token vs underlying stock
Current comparison for NVDA. Historical observations may postdate this article.
Split-adjusted regular-session stock closes from the existing Gloria shared history, paired only with an observed token price within 45 minutes of 16:00 New York time. Up to 60 matched sessions. No interpolation or missing-date fill. Weekends and known early closes are omitted. Token units are not adjusted for issuer multipliers or dividend treatment. This compares quoted prices, not fair value, executable premiums or arbitrage returns. Solid line: token. Dashed line: stock. Exact quote times and values appear below. Historical observations. Retrieval refers to the token source. Token quote times use UTC. The fixed cohort shows its oldest member fetch.
Nvidia token vs Nvidia stock: exact source values
Date (UTC)
Token (USD)
Stock close (USD)
Token quote (UTC)
2026-08-05
219.87
219.22
2026-08-05 20:00
2026-08-06
219.15
218.99
2026-08-06 20:00
2026-08-07
223.93
223.96
2026-08-07 20:00
2026-08-10
217.66
217.55
2026-08-10 20:00
2026-08-11
217.53
217.50
2026-08-11 20:00
2026-08-12
224.12
224.09
2026-08-12 20:00
2026-08-13
225.42
225.30
2026-08-13 20:00
2026-08-14
225.34
225.16
2026-08-14 20:00
2026-08-17
225.13
225.01
2026-08-17 20:00
2026-08-18
219.70
219.74
2026-08-18 20:00
2026-08-19
217.76
217.56
2026-08-19 20:00
2026-08-20
216.79
216.85
2026-08-20 20:00
2026-08-21
214.85
214.72
2026-08-21 20:00
2026-08-24
208.75
208.48
2026-08-24 20:00
2026-08-25
213.16
213.05
2026-08-25 20:00
2026-08-26
210.06
209.66
2026-08-26 20:00
2026-08-27
227.96
227.98
2026-08-27 20:00
2026-08-28
217.74
217.55
2026-08-28 20:00
2026-08-31
220.91
220.78
2026-08-31 20:00
2026-09-01
217.58
217.44
2026-09-01 20:00
2026-09-02
224.46
224.41
2026-09-02 20:00
2026-09-03
228.90
228.45
2026-09-03 20:00
2026-09-04
230.35
230.36
2026-09-04 20:00
2026-09-08
225.69
225.73
2026-09-08 20:00
2026-09-09
223.89
223.67
2026-09-09 20:00
2026-09-10
218.70
218.36
2026-09-10 20:00
2026-09-11
218.92
218.29
2026-09-11 20:00
2026-09-14
211.47
210.96
2026-09-14 20:00
2026-09-15
212.34
212.17
2026-09-15 20:00
2026-09-16
214.25
213.90
2026-09-16 20:00
2026-09-17
219.68
219.34
2026-09-17 20:00
2026-09-18
222.24
222.27
2026-09-18 20:00
2026-09-21
227.69
227.38
2026-09-21 20:00
2026-09-22
229.20
228.87
2026-09-22 20:00
2026-09-23
225.44
225.51
2026-09-23 20:00
2026-09-24
224.87
224.58
2026-09-24 20:00
2026-09-25
225.29
225.07
2026-09-25 20:00
2026-09-28
228.97
228.86
2026-09-28 20:00
2026-09-29
227.95
227.21
2026-09-29 20:00
2026-09-30
229.85
228.38
2026-09-30 20:00
2026-10-01
231.18
230.86
2026-10-01 20:00
2026-10-02
234.38
233.95
2026-10-02 20:00
2026-10-05
239.30
238.90
2026-10-05 20:00
2026-10-06
239.71
239.24
2026-10-06 20:00
2026-10-07
237.80
237.47
2026-10-07 20:00
2026-10-08
230.81
230.48
2026-10-08 20:00
2026-10-09
229.70
229.28
2026-10-09 20:00
2026-10-12
226.87
226.32
2026-10-12 20:00
2026-10-13
228.73
228.52
2026-10-13 20:00
2026-10-14
221.56
221.30
2026-10-14 20:00
2026-10-15
217.48
217.23
2026-10-15 20:00
2026-10-16
214.56
214.13
2026-10-16 20:00
2026-10-19
217.41
217.09
2026-10-19 20:00
2026-10-20
216.69
216.47
2026-10-20 20:00
2026-10-21
222.20
221.97
2026-10-21 20:00
2026-10-22
212.42
212.21
2026-10-22 20:00
2026-10-23
211.27
210.96
2026-10-23 20:00
2026-10-26
216.15
216.00
2026-10-26 20:00
2026-10-27
218.06
217.94
2026-10-27 20:00
2026-10-28
215.40
215.38
2026-10-28 20:00
Stock history: Gloria · Retrieved Oct 29, 00:31 UTC. Token history: CoinGecko NVDAx.
Quoted token and share units can have different rights, multipliers and dividend treatment. This is not an executable premium or arbitrage signal.
The company that makes the brains inside nearly every AI system on the planet just told the world it won’t squeeze customers for every dollar. In an industry where demand far outpaces supply, that’s a genuinely unusual move.
At TSMC’s annual shareholders’ meeting on June 4, CEO C.C. Wei laid out a philosophy that sounds almost quaint in 2026: prioritize long-term relationships over short-term profit maximization. The chipmaker is forecasting over 30% sales growth for the year, and Wei made clear that supply shortages for AI applications aren’t going away anytime soon.
The pricing strategy that shouldn’t work but does
TSMC has achieved a gross margin of 66%, a figure that would make most manufacturers weep with envy. It’s just doing it through what Wei described as measured, predictable pricing rather than opportunistic spikes.
Earlier reports from September 2025 indicated TSMC had planned price increases of 5-10% on advanced semiconductor nodes heading into 2026. Major clients, including Nvidia, Apple, and AMD, were informed of those adjustments.
Wei’s framing was deliberate. He positioned TSMC’s customers as partners, not counterparties in a negotiation. Rather than extracting maximum revenue from each wafer today, TSMC is betting that keeping its biggest clients happy will generate far more value over the next decade.
Why AI demand changes the calculus
Wei predicted that chip supply will remain insufficient for AI applications for years to come. TSMC produces the cutting-edge silicon that powers Nvidia’s data center GPUs, Apple’s latest processors, and AMD’s accelerators. Samsung Foundry and Intel remain years behind on the most advanced nodes.
The news moving money, markets, and the world—before your day starts.
Daily. Free. Join 34,000+ readers across crypto, finance, and policy.
TSMC operates in an environment where US tariffs, export controls, and broader tensions between Washington and Beijing create constant uncertainty. Maintaining goodwill with the world’s largest technology companies provides a buffer against political headwinds. By keeping increases modest and predictable, TSMC also reduces the economic incentive for companies like Apple or Google to diversify their supply chains more aggressively.
What this means for investors
A 66% gross margin combined with 30%-plus revenue growth is the kind of profile that belongs in the conversation with the best businesses in any sector, not just chips.
For the broader technology ecosystem, TSMC’s restraint functions as a subsidy of sorts. Every dollar that Nvidia or AMD doesn’t spend on wafer costs is a dollar that can go toward R&D, lower end-product pricing, or margin expansion.
Intel’s foundry ambitions and Samsung’s push to close the manufacturing gap both depend partly on TSMC becoming too expensive for customers to tolerate. By keeping pricing moderate, Wei is effectively pulling the rug out from under the strongest argument his competitors could make to potential defectors.
TSMC’s confidence in sustained demand is itself a data point. When the company with the best visibility into global chip orders says supply will lag demand for years, that’s not a forecast. It’s closer to a census of what’s already been ordered.
Disclosure: This article was edited by Editorial Team. For more information on how we create and review content, see our Editorial Policy.