+17.8% (FY ended 2026-06-30 vs FY ended 2025-06-30) 10-K
Annual net income
133,749,000,000 USD (FY ended 2026-06-30, attributable to the company) 10-K
Annual operating margin
46.8% (FY ended 2026-06-30)
Forward P/E
Unavailable: no dated forecast source
Gloria daily close for session Oct 27, 2026. Market cap and trailing P/E use this close with the SEC share total and trailing diluted earnings, each dated next to its figure. Annual revenue, revenue growth, net income and margin show their own fiscal period and link the 10-K. Current context may postdate this article.
−162,502,000FY ended 2026-01-31, attributable to the company · 10-K
−6.1%FY ended 2026-01-31
Missing figures stay unavailable. Forward P/E requires a dated source. Annual revenue, revenue growth, net income and margin come from each company's own 10-K, in US dollars, and each row shows that fiscal year. Revenue growth compares the fiscal year with the prior year stated in the same 10-K. Net income is the full year amount attributable to the company, or available to common stockholders where the filing states only that, or consolidated net income. Each row names its basis. Trailing P/E reads "Not meaningful" when the dated trailing diluted EPS is a loss or zero. An operating margin appears only when the filing states both the operating income and the revenue for the same year.
Sources: SEC filings, Gloria daily closes and CoinGecko. Oldest record refresh: Oct 27, 2026, 10:56 PM EDT. Refresh is not a price or filing date. Each row shows its price date and its annual fiscal period. Peers use industry code and company size, or editorial selection. Market cap multiplies that row price by the company share total the latest SEC filing states for every share class together. Trailing P/E divides it by trailing diluted earnings from SEC filings. Rolled earnings per share are approximate because share counts can change between periods. Both appear only when the SEC data carries its date, so they are estimates at one price date, not synchronized filing valuations. Not investment advice.
Token vs underlying stock
Current comparison for MSFT. Historical observations may postdate this article.
Split-adjusted regular-session stock closes from the existing Gloria shared history, paired only with an observed token price within 45 minutes of 16:00 New York time. Up to 60 matched sessions. No interpolation or missing-date fill. Weekends and known early closes are omitted. Token units are not adjusted for issuer multipliers or dividend treatment. This compares quoted prices, not fair value, executable premiums or arbitrage returns. Solid line: token. Dashed line: stock. Exact quote times and values appear below. Historical observations. Retrieval refers to the token source. Token quote times use UTC. The fixed cohort shows its oldest member fetch.
Microsoft token vs Microsoft stock: exact source values
Date (UTC)
Token (USD)
Stock close (USD)
Token quote (UTC)
2026-08-04
499.08
492.81
2026-08-04 20:00
2026-08-05
484.73
487.46
2026-08-05 20:00
2026-08-06
498.48
499.86
2026-08-06 20:00
2026-08-07
501.35
499.99
2026-08-07 20:00
2026-08-10
507.81
506.06
2026-08-10 20:00
2026-08-11
503.83
503.81
2026-08-11 20:00
2026-08-12
493.50
492.43
2026-08-12 20:00
2026-08-13
494.66
496.88
2026-08-13 20:00
2026-08-14
496.96
495.40
2026-08-14 20:00
2026-08-17
481.91
480.35
2026-08-17 20:00
2026-08-18
482.93
481.63
2026-08-18 20:00
2026-08-19
484.48
484.31
2026-08-19 20:00
2026-08-20
482.95
481.15
2026-08-20 20:00
2026-08-21
485.28
483.24
2026-08-21 20:00
2026-08-24
489.80
487.31
2026-08-24 20:00
2026-08-25
491.36
491.71
2026-08-25 20:00
2026-08-26
498.86
496.37
2026-08-26 20:00
2026-08-27
506.15
505.06
2026-08-27 20:00
2026-08-28
514.87
513.53
2026-08-28 20:00
2026-08-31
510.07
507.29
2026-08-31 20:00
2026-09-01
503.61
501.02
2026-09-01 20:00
2026-09-02
497.76
496.82
2026-09-02 20:00
2026-09-03
512.63
510.12
2026-09-03 20:00
2026-09-04
500.58
499.70
2026-09-04 20:00
2026-09-08
493.27
493.95
2026-09-08 20:00
2026-09-09
491.69
491.65
2026-09-09 20:00
2026-09-10
493.07
492.44
2026-09-10 20:00
2026-09-11
498.52
495.63
2026-09-11 20:00
2026-09-14
508.54
505.41
2026-09-14 20:00
2026-09-15
498.86
497.12
2026-09-15 20:00
2026-09-16
494.48
490.30
2026-09-16 20:00
2026-09-17
500.28
497.75
2026-09-17 20:00
2026-09-18
496.33
493.78
2026-09-18 20:00
2026-09-21
503.22
501.61
2026-09-21 20:00
2026-09-22
501.25
498.00
2026-09-22 20:00
2026-09-23
503.06
500.59
2026-09-23 20:00
2026-09-24
501.07
497.93
2026-09-24 20:00
2026-09-25
518.98
516.17
2026-09-25 20:00
2026-09-28
511.70
509.22
2026-09-28 20:00
2026-09-29
512.06
508.96
2026-09-29 20:00
2026-09-30
515.27
512.90
2026-09-30 20:00
2026-10-01
516.84
512.80
2026-10-01 20:00
2026-10-02
519.95
517.53
2026-10-02 20:00
2026-10-05
527.35
525.18
2026-10-05 20:00
2026-10-06
532.35
529.30
2026-10-06 20:00
2026-10-07
532.01
529.76
2026-10-07 20:00
2026-10-08
525.93
522.61
2026-10-08 20:00
2026-10-09
537.45
535.07
2026-10-09 20:00
2026-10-12
543.48
541.15
2026-10-12 20:00
2026-10-13
546.06
543.45
2026-10-13 20:00
2026-10-14
535.70
533.69
2026-10-14 20:00
2026-10-15
542.43
539.44
2026-10-15 20:00
2026-10-16
531.87
529.05
2026-10-16 20:00
2026-10-19
535.69
533.52
2026-10-19 20:00
2026-10-20
535.30
531.87
2026-10-20 20:00
2026-10-21
535.87
532.95
2026-10-21 20:00
2026-10-22
524.11
521.08
2026-10-22 20:00
2026-10-23
525.75
524.51
2026-10-23 20:00
2026-10-26
534.07
532.60
2026-10-26 20:00
2026-10-27
533.36
531.33
2026-10-27 20:00
Stock history: Gloria · Retrieved Oct 28, 00:31 UTC. Token history: CoinGecko MSFTx.
Quoted token and share units can have different rights, multipliers and dividend treatment. This is not an executable premium or arbitrage signal.
Microsoft Research just dropped a set of AI models that can browse the web better than anything OpenAI or Google has built. And in a twist that should make the closed-source crowd uncomfortable, the models are open-weight.
The Fara1.5 family, released on May 22, comprises three models with 4B, 9B, and 27B parameters. The flagship 27B variant scored 72% on the Online-Mind2Web benchmark, a grueling test that throws 300 tasks across 136 live websites at browser-using AI agents. OpenAI’s Operator managed 58.3%. Google’s Gemini 2.5 Computer Use hit 57.3%. In English: Microsoft’s model completed nearly three-quarters of real-world web tasks successfully, while its Big Tech rivals couldn’t crack six in ten.
The benchmark gap is real
The 9B model scored 63.4%, which puts it ahead of both OpenAI’s and Google’s proprietary systems despite being a fraction of their size. It came within striking distance of Yutori Navigator n1, a competitive agent that posted 64.7%.
For context on how fast this space is moving: Microsoft’s previous model, Fara-7B, launched in November 2025 and scored just 34.1% on the same benchmark. That means the team roughly doubled performance in about six months.
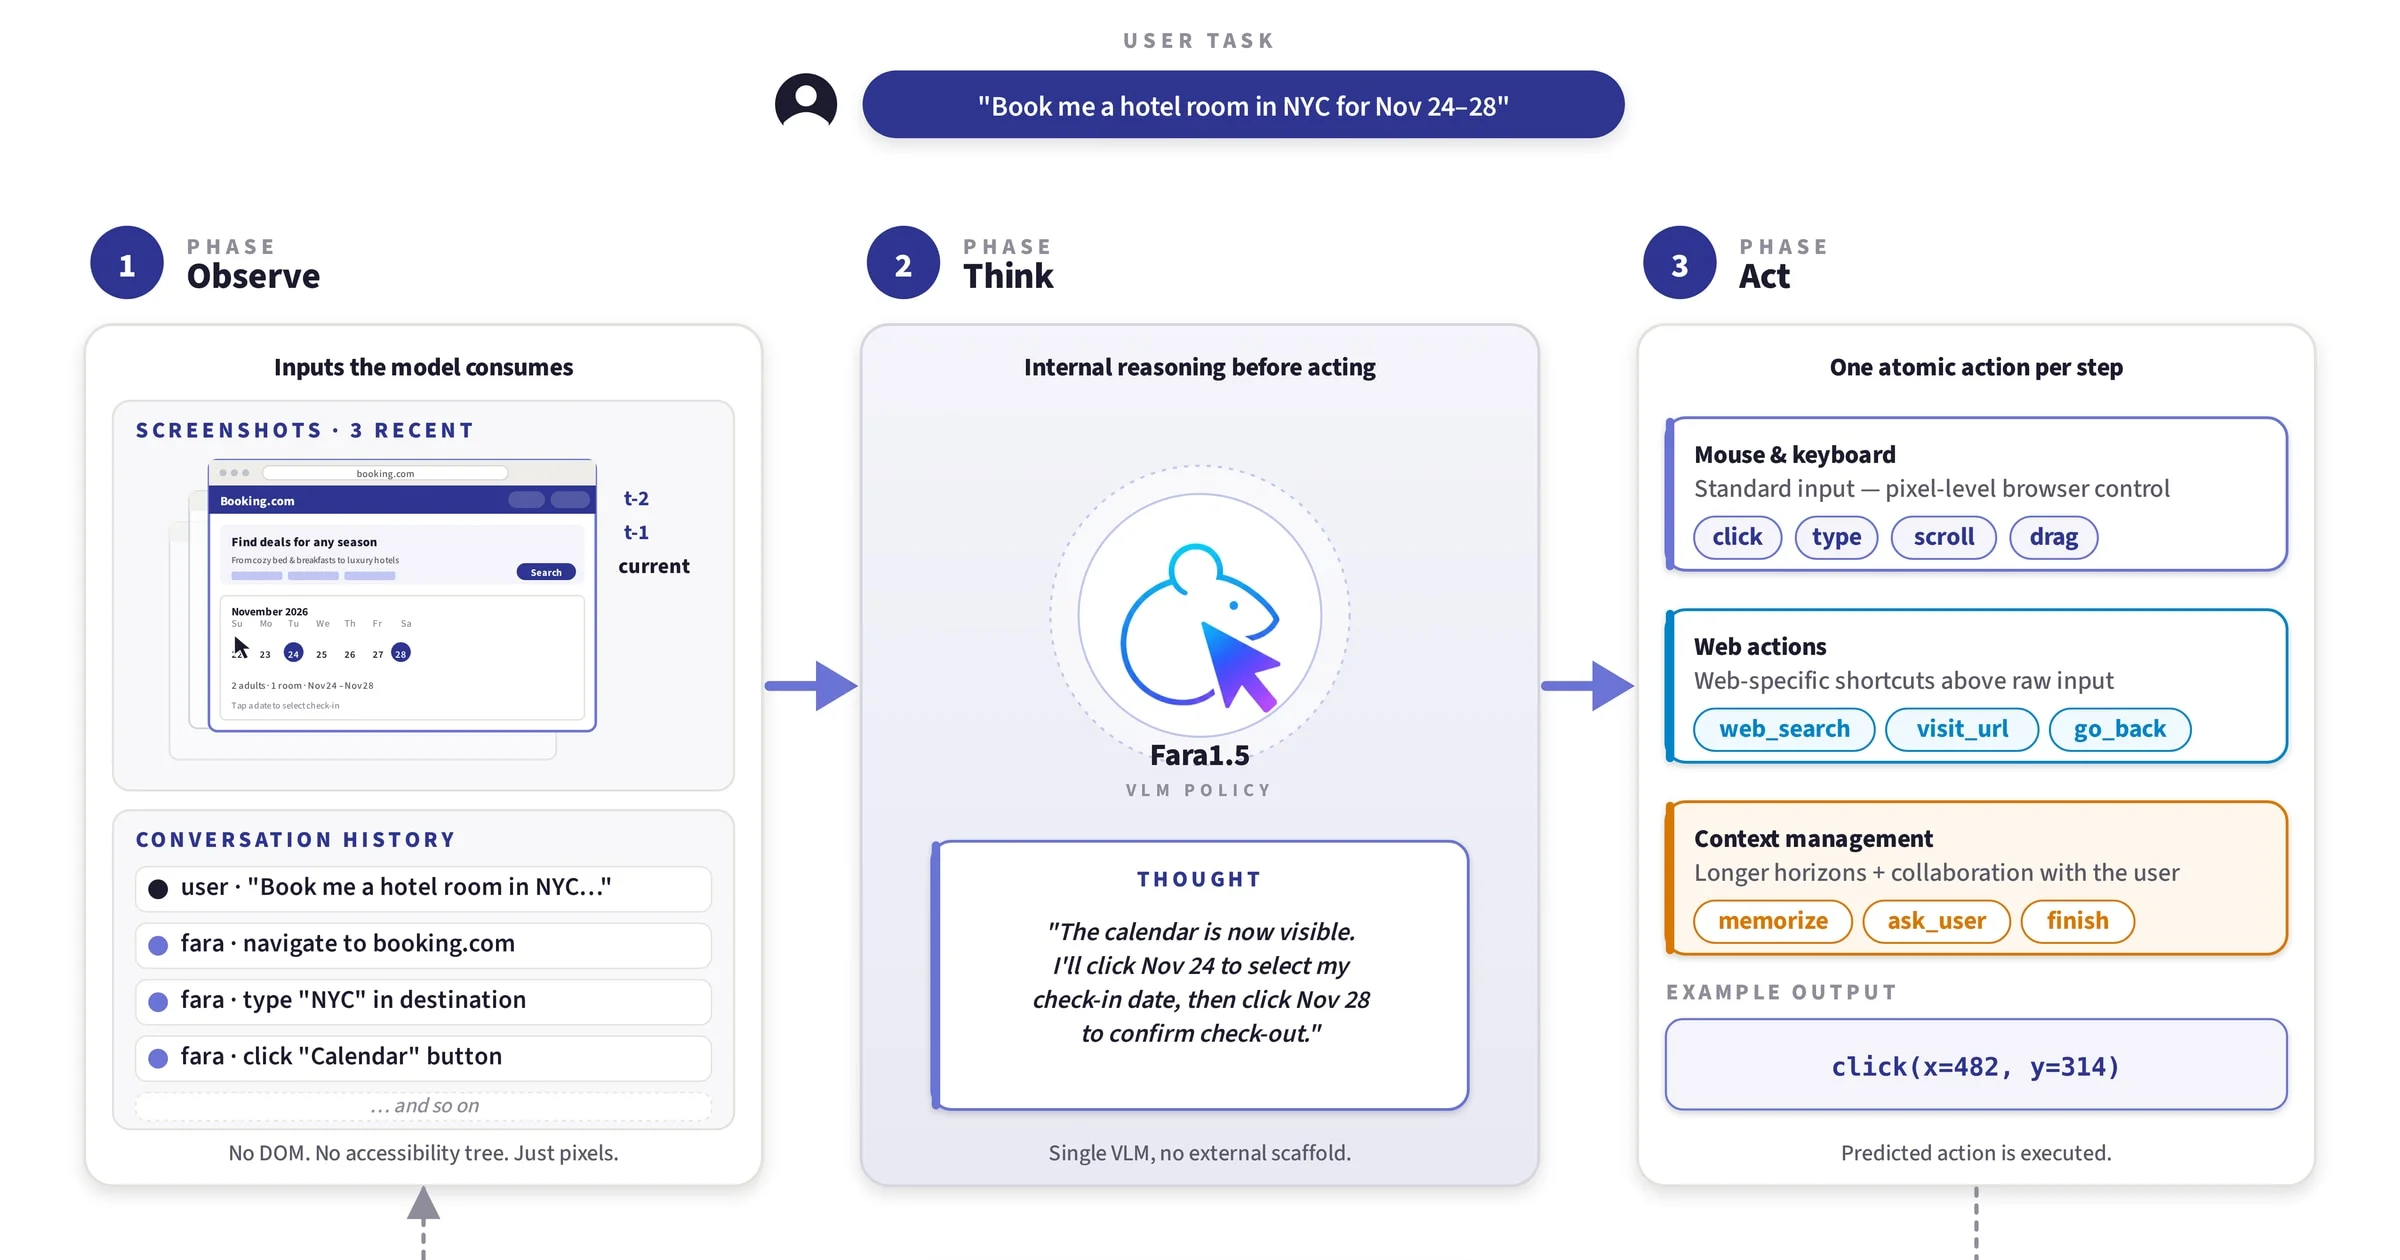
The models are built on the Qwen3.5 architecture and use something called MagenticLite, a sandboxed browser interface that gives the agent a controlled environment to interact with web pages. They also incorporate an observe-think-act loop with a human-in-the-loop safeguard, meaning the agent pauses before executing critical actions like purchases or account changes and asks the user for confirmation.
Microsoft has made the 9B model available on Microsoft Foundry, with the 4B and 27B versions expected to follow.
The news moving money, markets, and the world—before your day starts.
Daily. Free. Join 34,000+ readers across crypto, finance, and policy.
OpenAI’s Operator and Google’s Gemini 2.5 Computer Use are proprietary systems. Fara1.5 being open-weight means developers can download, modify, and deploy these models on their own hardware. Microsoft specifically designed the Fara1.5 family to run efficiently on modest hardware, with proportional scaling benefits as you move up in model size.
The training pipeline also got a significant upgrade. Microsoft introduced FaraGen1.5, an enhanced synthetic data pipeline that generates better training examples for complex browser interactions.
What this means for crypto and DeFi
Microsoft didn’t build Fara1.5 with crypto in mind. There are no direct integrations with any blockchain protocol, DeFi application, or Web3 project.
DeFi interfaces are web applications. Swapping tokens on Uniswap, managing a vault on Aave, bridging assets across chains: these are all browser-based tasks involving forms, confirmations, and multi-step workflows — exactly the kind of thing Fara1.5 was trained to handle.
The human-in-the-loop design is particularly relevant here. DeFi transactions are irreversible. An agent that pauses before signing a transaction and asks for confirmation addresses one of the biggest risks in autonomous on-chain activity: accidentally approving a malicious contract or sending funds to the wrong address.
Disclosure: This article was edited by Editorial Team. For more information on how we create and review content, see our Editorial Policy.